
Learn Coding Visually
Learn to code with interactive, live-preview playgrounds — HTML, CSS, JavaScript, React & more.
 HTML Playground42 lessons · Click-based · Live preview
 CSS PlaygroundLearn CSS with a live editor
 JavaScript Playground60 lessons · DOM · Async · Canvas
 React PlaygroundLearn React with a live code editor
 GSAP PlaygroundLearn GSAP animation interactively
 SVG Playground44 lessons · shapes · paths · animation
 SCSS Playground45 lessons · Sass modules · tokens
 Tailwind PlaygroundLearn Tailwind CSS with a live editor
 Bootstrap 5 Playground50 lessons · live preview
Animated Stat Row — Free HTML CSS JS Dashboard Snippet
Animated Stat Row · Dashboards · Plain HTML, CSS & JS · Live preview
What's included
Features
About this UI Snippet
Animated Stat Row — Count-Up KPI Cards That Reveal on Scroll with Stagger

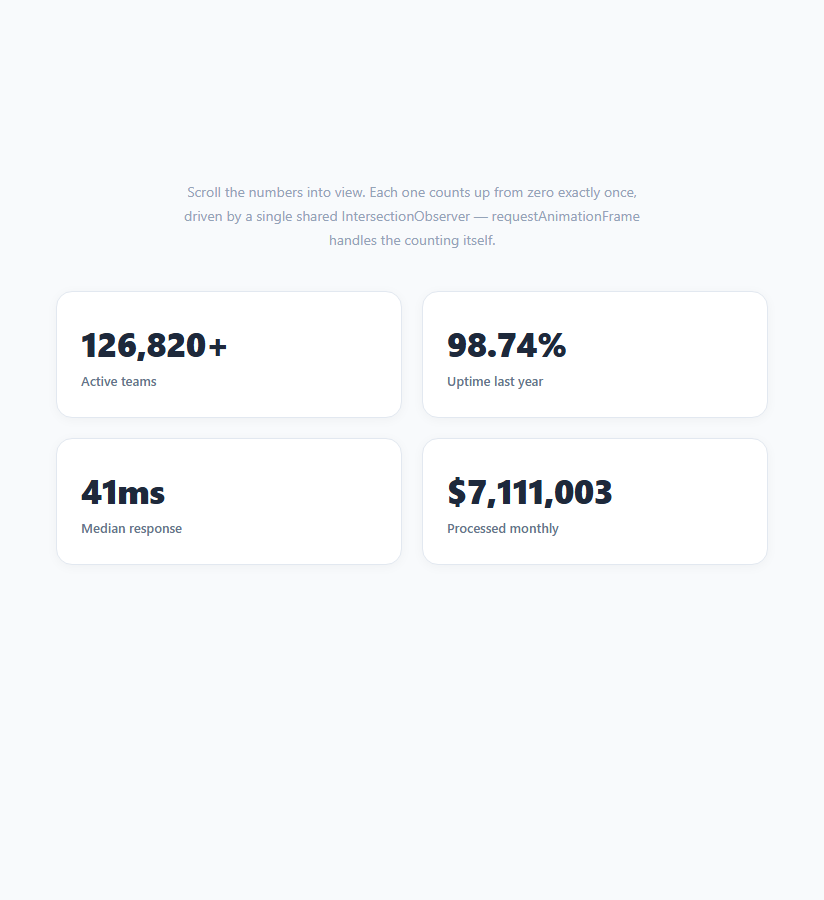
Numbers land harder when they animate. A row of KPI cards that fade up and count from zero to their value the moment they scroll into view is a staple of dashboards, landing pages, and annual reports — it draws the eye to the metrics and makes static figures feel alive. This component is a complete, responsive stat row: four cards with coloured icons, a count-up value, a label, and a period-over-period delta badge, that reveal with a stagger and count up using an eased animation, triggered by IntersectionObserver and respectful of reduced-motion preferences. It is built in HTML, CSS, and vanilla JavaScript.
Scroll-triggered, not on-load
The animation fires when the cards enter the viewport, not when the page loads — so if the stat row is below the fold, the count-up plays right as the user scrolls to it for maximum impact. IntersectionObserver watches each card with a threshold: 0.4 (40% visible), and on intersection it reveals and counts that card, then unobserves it so the animation runs exactly once. This is far more efficient than a scroll-position listener and guarantees the numbers are not already finished animating before the user ever sees them.
The eased count-up
countUp() drives the number with requestAnimationFrame, not setInterval — so it is synced to the display's refresh rate and never drops frames or drifts. Each frame computes progress t from performance.now() over a 1400ms duration, then applies an easeOutExpo curve (1 - 2^(-10t)): the number races up at the start and decelerates smoothly into its final value, which feels much more dynamic than a linear count. The displayed value is rounded and run through toLocaleString() so large numbers keep thousands separators, with optional prefix ($) and suffix (%) read from data attributes.
Data attributes drive everything
Each card declares its target in markup: data-to for the final number, data-prefix and data-suffix for formatting. The script reads these, so there is no hard-coded list in the JavaScript — to change a stat you edit the HTML. The value element uses font-variant-numeric: tabular-nums so every digit is the same width, which stops the card from jittering horizontally as the number rapidly changes during the count.
The staggered reveal
Cards do not all animate at once — each is delayed by its index times 120ms, so they cascade left to right. The reveal itself is CSS: cards start at opacity: 0 and translateY(14px) and transition to visible when the .in class is added, with a slight overshoot easing. The stagger plus the count-up together create the "dashboard coming to life" effect without any animation library.
Respecting reduced motion
Users who set prefers-reduced-motion: reduce (for vestibular comfort) should not be subjected to counting numbers and sliding cards. The script checks matchMedia('(prefers-reduced-motion: reduce)') and, when true, sets each value straight to its final figure with no count-up. The reveal transition is gentle enough to keep, but the potentially dizzying count animation is skipped — the accessible, considerate default.
The delta badges and customisation
Each card shows a coloured delta pill — green for up, red for down, grey for flat — to give the number context at a glance. Icons are tinted from a single --c custom property per card using color-mix for the soft background, so theming a card is one value. The row is a four-column grid that collapses to two columns under 760px and one under 380px. To use it, edit the cards' targets, labels, icons, colours, and deltas; the animation logic adapts automatically.
Build with AI
Build, Understand, Optimize, and Extend It With AI
You don't have to derive the easing curve or the observer logic by hand — paste this snippet's HTML, CSS, and JS into an AI coding assistant like Claude and ask it to explain exactly how the easeOutExpo formula (1 minus 2 to the power of negative 10t) produces a fast-start, decelerating count, and why unobserve is called on each card right after it fires so the animation never replays on repeated scrolling. The same assistant is useful for optimizing it — asking whether four separate requestAnimationFrame loops (one per card) should be consolidated into a single loop that updates all in-progress cards, especially if this row were repeated many times on one long dashboard page. It's just as good for extending it: ask it to support decimal-value stats (not just integers), add a hover state that reveals the exact previous-period number behind the delta badge, or drive the data-to targets from a live API response instead of hardcoded data attributes. Treat the code less like a finished artifact and more like a starting point for a conversation.
Prompt to recreate it
Copy this into your AI assistant of choice to build the effect from scratch, or as a jumping-off point for your own variant:
Build an "animated stat row" of KPI cards in plain HTML, CSS, and JavaScript — no libraries, using IntersectionObserver and requestAnimationFrame, with each card's target value read from data attributes rather than hardcoded in the script.

Requirements:
- A responsive grid of stat cards, each declaring its final numeric value plus an optional prefix and suffix string via data attributes (e.g. data-to, data-prefix, data-suffix) directly in the HTML, with an icon, a large value display, a label, and a colored up/down/flat delta badge.
- Each card starts invisible and slightly offset (opacity 0, translated down a few pixels). Use an IntersectionObserver watching all cards with a threshold around 0.4, so a card only begins animating once it is meaningfully visible in the viewport, and call unobserve on each card immediately after it fires so the animation never re-triggers on repeated scrolling.
- When a card becomes visible, add a class that triggers its CSS reveal transition, and simultaneously start a JavaScript count-up of its number from zero to its target using requestAnimationFrame (not setInterval), computing progress from performance.now() over a fixed duration and applying an easeOutExpo easing curve (fast start, decelerating finish) rather than a linear ramp.
- Format the displayed number on every frame by rounding it and passing it through toLocaleString so thousands separators appear correctly, wrapping it with the card's prefix and suffix strings. Use a numeric font feature (tabular figures) on the value element so the digits don't jitter the layout width as they change.
- Stagger multiple simultaneously-visible cards so they don't all animate at the exact same instant — delay each one by its index times a fixed small amount (like 120ms) so they cascade in sequence.
- Check for prefers-reduced-motion via matchMedia at the top of the script, and when it's set, skip the count-up animation entirely, writing each card's final formatted value immediately instead (though the fade-in reveal transition may remain, since it's not the actual source of motion discomfort).
Want to tighten it up first? Run this prompt through the AI Prompt Studio to score it across 8 quality dimensions, catch anti-patterns, and tune the wording for Claude, ChatGPT, or Gemini before you paste it in.
Source Code
<div class="asr-row" id="asrRow">
  <div class="asr-stat" data-to="48295" data-prefix="$" data-suffix="">
    <div class="asr-ico" style="--c:#6366f1"><svg viewBox="0 0 24 24" aria-hidden="true"><line x1="12" y1="1" x2="12" y2="23"/><path d="M17 5H9.5a3.5 3.5 0 0 0 0 7h5a3.5 3.5 0 0 1 0 7H6"/></svg></div>
    <div class="asr-val" data-role="val">0</div>
    <div class="asr-label">Revenue this month</div>
    <div class="asr-delta up">▲ 12.4%</div>
  </div>

  <div class="asr-stat" data-to="2841" data-prefix="" data-suffix="">
    <div class="asr-ico" style="--c:#0ea5e9"><svg viewBox="0 0 24 24" aria-hidden="true"><path d="M17 21v-2a4 4 0 0 0-4-4H5a4 4 0 0 0-4 4v2"/><circle cx="9" cy="7" r="4"/><path d="M23 21v-2a4 4 0 0 0-3-3.87"/></svg></div>
    <div class="asr-val" data-role="val">0</div>
    <div class="asr-label">Active users</div>
    <div class="asr-delta up">▲ 8.1%</div>
  </div>

  <div class="asr-stat" data-to="96" data-prefix="" data-suffix="%">
    <div class="asr-ico" style="--c:#16a34a"><svg viewBox="0 0 24 24" aria-hidden="true"><polyline points="20 6 9 17 4 12"/></svg></div>
    <div class="asr-val" data-role="val">0</div>
    <div class="asr-label">Uptime</div>
    <div class="asr-delta flat">— 0.0%</div>
  </div>

  <div class="asr-stat" data-to="312" data-prefix="" data-suffix="">
    <div class="asr-ico" style="--c:#f97316"><svg viewBox="0 0 24 24" aria-hidden="true"><path d="M21 15a2 2 0 0 1-2 2H7l-4 4V5a2 2 0 0 1 2-2h14a2 2 0 0 1 2 2z"/></svg></div>
    <div class="asr-val" data-role="val">0</div>
    <div class="asr-label">Open tickets</div>
    <div class="asr-delta down">▼ 3.2%</div>
  </div>
</div>
* { box-sizing: border-box; margin: 0; padding: 0; }
body { font-family: system-ui, -apple-system, sans-serif; background: #f1f5f9; min-height: 100vh; display: flex; align-items: center; justify-content: center; padding: 32px; }
.asr-row { display: grid; grid-template-columns: repeat(4, 1fr); gap: 16px; width: 100%; max-width: 860px; }
.asr-stat {
background: #fff; border: 1px solid #e8edf3; border-radius: 15px;
padding: 20px;
opacity: 0; transform: translateY(14px);
transition: opacity 0.5s ease, transform 0.5s cubic-bezier(0.2, 0.8, 0.2, 1);
}
.asr-stat.in { opacity: 1; transform: translateY(0); }
.asr-ico { width: 38px; height: 38px; display: flex; align-items: center; justify-content: center; border-radius: 10px; background: color-mix(in srgb, var(--c) 14%, #fff); color: var(--c); margin-bottom: 14px; }
.asr-ico svg { width: 19px; height: 19px; fill: none; stroke: currentColor; stroke-width: 2; stroke-linecap: round; stroke-linejoin: round; }
.asr-val { font-size: 28px; font-weight: 800; color: #0f172a; letter-spacing: -0.02em; font-variant-numeric: tabular-nums; }
.asr-label { font-size: 13px; color: #64748b; margin-top: 4px; }
.asr-delta { display: inline-block; margin-top: 12px; font-size: 12px; font-weight: 700; padding: 2px 8px; border-radius: 999px; }
.asr-delta.up { color: #16a34a; background: #dcfce7; }
.asr-delta.down { color: #dc2626; background: #fee2e2; }
.asr-delta.flat { color: #64748b; background: #f1f5f9; }
@media (max-width: 760px) { .asr-row { grid-template-columns: repeat(2, 1fr); } }
@media (max-width: 380px) { .asr-row { grid-template-columns: 1fr; } }const row = document.getElementById('asrRow');
const stats = [...row.querySelectorAll('.asr-stat')];
const reduce = window.matchMedia('(prefers-reduced-motion: reduce)').matches;
function format(n, prefix, suffix) {
return prefix + Math.round(n).toLocaleString() + suffix;
}
function countUp(stat) {
const target = parseFloat(stat.dataset.to);
const prefix = stat.dataset.prefix || '';
const suffix = stat.dataset.suffix || '';
const valEl = stat.querySelector('[data-role="val"]');
if (reduce) { valEl.textContent = format(target, prefix, suffix); return; }
const duration = 1400;
const start = performance.now();
function frame(now) {
const t = Math.min((now - start) / duration, 1);
// easeOutExpo for a fast start that decelerates into the final value
const eased = t === 1 ? 1 : 1 - Math.pow(2, -10 * t);
valEl.textContent = format(target * eased, prefix, suffix);
if (t < 1) requestAnimationFrame(frame);
}
requestAnimationFrame(frame);
}
// Reveal + count each card when it scrolls into view, staggered
const observer = new IntersectionObserver((entries) => {
entries.forEach(entry => {
if (!entry.isIntersecting) return;
const stat = entry.target;
const i = stats.indexOf(stat);
setTimeout(() => {
stat.classList.add('in');
countUp(stat);
}, i * 120);
observer.unobserve(stat);
});
}, { threshold: 0.4 });
stats.forEach(s => observer.observe(s));Step by step
How to Use
- 1Paste the HTML, CSS, and JSA row of four KPI cards renders; when it scrolls into view the cards fade up in sequence and their numbers count from zero.
- 2Scroll it into viewIntersectionObserver triggers each card at 40% visibility, staggered 120ms apart, with an easeOutExpo count-up over 1.4s.
- 3Check the deltasEach card shows a coloured up/down/flat pill giving period-over-period context beside the value.
- 4Edit the statsChange each card's data-to target, data-prefix/data-suffix, label, icon, and --c colour directly in the markup.
- 5Resize the windowThe four-column grid collapses to two columns under 760px and one under 380px.
- 6Respect reduced motionUsers with prefers-reduced-motion get the final numbers immediately with no count-up — no code change needed.
Real-world uses
Common Use Cases
Got questions?
Frequently Asked Questions
If the stat row is below the fold and you animate on load, the count-up finishes before the user scrolls to it, so they miss the effect entirely. IntersectionObserver starts the animation the moment the cards become visible (40% here), so the count-up plays right when the user is looking. It also avoids a scroll-event listener, and unobserve() after firing ensures each card animates exactly once.
requestAnimationFrame syncs to the display's refresh rate, so the count is smooth and pauses automatically when the tab is backgrounded. setInterval runs on a fixed timer that can drift, fire during repaints, or stack up, causing janky or inconsistent counting. Computing progress from performance.now() each frame also makes the total duration exact regardless of frame rate.
Each card carries data-to (the target number), data-prefix (e.g. $), and data-suffix (e.g. %). Edit those in the markup to change a stat — no JavaScript edit needed. To add a card, copy a .asr-stat block, set its data attributes, icon, --c colour, label, and delta; the observer picks it up automatically since the script queries all .asr-stat elements at load.
Yes. It checks window.matchMedia('(prefers-reduced-motion: reduce)') and, when set, writes each value straight to its final figure with no count-up animation. This respects users who experience discomfort from motion. The subtle fade-up reveal is kept since it is gentle, but the rapidly changing numbers — the part most likely to cause issues — are skipped.
Render the stats from an array of { to, prefix, suffix, label, color, delta }. Set up the IntersectionObserver in an effect (useEffect / onMounted / ngAfterViewInit) observing refs to the cards, and disconnect it on cleanup. Drive the displayed number with a rAF loop in the same effect (cancel it on unmount), storing the current value in state. Check prefers-reduced-motion before animating. The CSS — reveal, delta pills, color-mix theming — ports unchanged.