Source Code
<div class="sig-card">
  <div class="sig-bars" id="sigBars" role="img" aria-label="Signal strength">
    <span class="sig-bar"></span>
    <span class="sig-bar"></span>
    <span class="sig-bar"></span>
    <span class="sig-bar"></span>
    <span class="sig-bar"></span>
  </div>
  <div class="sig-label" id="sigLabel">Excellent</div>
  <label class="sig-range">Strength
    <input type="range" id="sigRange" min="0" max="5" value="5">
  </label>
  <button type="button" class="sig-scan" id="sigScan">Simulate scanning</button>
</div>*{box-sizing:border-box;margin:0;padding:0}
body{font-family:system-ui,-apple-system,sans-serif;background:#0f172a;color:#e2e8f0;display:flex;justify-content:center;padding:34px 18px}
.sig-card{background:#1e293b;border:1px solid #334155;border-radius:16px;padding:26px;width:100%;max-width:280px;text-align:center}
.sig-bars{display:flex;align-items:flex-end;justify-content:center;gap:5px;height:54px;margin-bottom:14px}
.sig-bar{width:14px;border-radius:4px 4px 2px 2px;background:#334155;transition:background .25s,opacity .25s}
.sig-bar:nth-child(1){height:20%}
.sig-bar:nth-child(2){height:40%}
.sig-bar:nth-child(3){height:60%}
.sig-bar:nth-child(4){height:80%}
.sig-bar:nth-child(5){height:100%}
.sig-bar.on{background:var(--sig,#22c55e)}
.sig-label{font-size:15px;font-weight:800;margin-bottom:20px;color:var(--sig,#22c55e);transition:color .25s}
.sig-range{display:block;font-size:11px;font-weight:700;color:#94a3b8;text-transform:uppercase;letter-spacing:.05em;text-align:left;margin-bottom:16px}
.sig-range input{width:100%;margin-top:8px;accent-color:#22c55e;cursor:pointer}
.sig-scan{width:100%;background:#334155;color:#e2e8f0;border:1px solid #475569;border-radius:9px;padding:10px;font-size:12.5px;font-weight:700;cursor:pointer;font-family:inherit}
.sig-scan:hover{background:#3e4c63}
.sig-scan:disabled{opacity:.6;cursor:default}
.sig-bars.scanning .sig-bar{animation:sigScan 1s ease-in-out infinite}
.sig-bars.scanning .sig-bar:nth-child(2){animation-delay:.12s}
.sig-bars.scanning .sig-bar:nth-child(3){animation-delay:.24s}
.sig-bars.scanning .sig-bar:nth-child(4){animation-delay:.36s}
.sig-bars.scanning .sig-bar:nth-child(5){animation-delay:.48s}
@keyframes sigScan{0%,100%{background:#334155}50%{background:#38bdf8}}var bars = document.getElementById('sigBars');
var barEls = bars.querySelectorAll('.sig-bar');
var label = document.getElementById('sigLabel');
var range = document.getElementById('sigRange');
var scanBtn = document.getElementById('sigScan');
var LEVELS = [
{ name: 'No signal', color: '#64748b' },
{ name: 'Poor', color: '#ef4444' },
{ name: 'Weak', color: '#f59e0b' },
{ name: 'Fair', color: '#eab308' },
{ name: 'Good', color: '#84cc16' },
{ name: 'Excellent', color: '#22c55e' }
];
function paint() {
var level = Number(range.value);
var meta = LEVELS[level];
for (var i = 0; i < barEls.length; i++) {
var lit = i < level;
barEls[i].classList.toggle('on', lit);
barEls[i].style.setProperty('--sig', meta.color);
}
label.textContent = meta.name;
label.style.setProperty('--sig', meta.color);
bars.setAttribute('aria-label', 'Signal strength: ' + meta.name);
}
range.addEventListener('input', paint);
var scanning = false, hop = null;
scanBtn.addEventListener('click', function () {
scanning = !scanning;
bars.classList.toggle('scanning', scanning);
scanBtn.textContent = scanning ? 'Stop scanning' : 'Simulate scanning';
if (scanning) {
range.disabled = true;
// After a beat, "lock on" to a random strength.
hop = setTimeout(function () {
scanning = false;
bars.classList.remove('scanning');
scanBtn.textContent = 'Simulate scanning';
range.disabled = false;
range.value = 2 + Math.floor(Math.random() * 4); // 2..5
paint();
}, 2200);
} else {
clearTimeout(hop);
range.disabled = false;
}
});
paint();Learn Coding Visually
Learn to code with interactive, live-preview playgrounds — HTML, CSS, JavaScript, React & more.
 HTML Playground42 lessons · Click-based · Live preview
 CSS PlaygroundLearn CSS with a live editor
 JavaScript Playground60 lessons · DOM · Async · Canvas
 React PlaygroundLearn React with a live code editor
 GSAP PlaygroundLearn GSAP animation interactively
 SVG Playground44 lessons · shapes · paths · animation
 SCSS Playground45 lessons · Sass modules · tokens
 Tailwind PlaygroundLearn Tailwind CSS with a live editor
 Bootstrap 5 Playground50 lessons · live preview
Signal Strength Bars — Free CSS Wifi Bars JS Snippet
Signal Strength Bars · Loaders · Plain HTML, CSS & JS · Live preview
What's included
Features
About this UI Snippet
Signal Strength Bars — Wifi / Cellular Level Meter
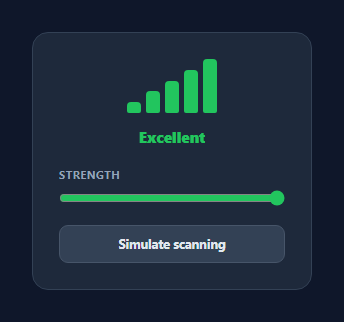
Signal strength bars are the stepped meter that shows wifi, cellular, or connection quality as a row of rising bars — the icon in every status bar and the indicator on dashboards, network tools, and IoT devices. This snippet builds a fully interactive one in HTML, CSS, and vanilla JavaScript: five graduated bars that light up to a level, a color and text label that follow strength, and a "scanning" animation that hunts before locking on. No images, no icon font, no dependency.
Graduated bars from CSS heights
The five bars are sibling <span>s whose heights step from 20% to 100% using :nth-child selectors, so they form the classic ascending staircase with markup that's just five empty spans. Each lit bar gets an .on class and reads its color from a CSS custom property (--sig), which means a single variable recolors the whole meter.
Strength drives color and label together
A LEVELS array maps each strength (0–5) to a name and color — "No signal" grey, "Poor" red, through "Excellent" green. The paint() function lights bars below the current level, sets --sig on each, and updates the label text and color from the same entry, so the visual and the words can never disagree. It also writes the label into aria-label so assistive tech announces "Signal strength: Good".
The scanning animation
Pressing scan adds a .scanning class that runs a staggered sigScan keyframe — each bar flashes blue with an increasing animation-delay, producing a left-to-right sweep like a device searching for signal. The slider is disabled during the scan to lock the UI, and a setTimeout "locks on" after ~2.2s by clearing the animation and snapping to a random realistic strength (2–5).
State you can't desync
Everything renders through paint() from one source of truth (the slider value), and the scan path resets the same state when it finishes. There's no duplicated "which bars are lit" logic, so the bars, color, label, and accessibility text always reflect the same number.
Wiring to real connectivity
Map a real metric — RSSI in dBm, the Network Information API's effectiveType, or a ping latency bucket — onto 0–5 and call paint(). Because rendering is decoupled from the source, you can poll, subscribe to navigator.connection.onchange, or stream device telemetry without touching the view code.
Build with AI
Build, Understand, Optimize, and Extend It With AI
You don't have to work out the level-to-color mapping or the scan timing by hand. Paste this snippet's HTML, CSS, and JS into an AI coding assistant like Claude and ask it to explain exactly how the LEVELS array drives the bars, the label, and the aria-label from one source of truth in paint(), or why the --sig custom property is set per bar instead of on the container. The same assistant is useful for optimizing it too, for instance checking whether the staggered animation-delay values on the scanning keyframe scale cleanly if you add more bars. It is just as good for extending the meter: ask it to wire paint() up to the real Network Information API's effectiveType, add a numeric dBm readout beside the label, or animate the lock-on result with a bounce instead of an instant snap. Treat the code less like a finished artifact and more like a starting point for a conversation.
Prompt to recreate it
Copy this into your AI assistant of choice to build the effect from scratch, or as a jumping-off point for your own variant:
Build a wifi-style "signal strength bars" meter in plain HTML, CSS, and JavaScript — no canvas, no SVG, no libraries.

Requirements:
- Five sibling span elements inside a flex container aligned to the bottom, with heights stepped via nth-child selectors (20%, 40%, 60%, 80%, 100%) so they form an ascending staircase using only CSS heights.
- A single array mapping strength levels 0 through 5 to a label name and a color. A paint() function driven by a range input must, from that one array entry, toggle an "on" class on every bar below the current level, set a shared CSS custom property used for the lit bar color, update a text label, and update the container's aria-label so assistive tech announces the strength as text — all four outputs must come from the same lookup so they can never disagree.
- A "simulate scanning" button that adds a scanning class which runs a CSS keyframe animation on every bar, with each bar's animation-delay staggered slightly more than the previous one, producing a left-to-right sweeping effect while scanning is active.
- While scanning, disable the range input so the user cannot change the level mid-scan. After roughly two seconds, stop the scanning animation automatically, snap the range input to a randomly chosen realistic strength value, and re-run the same paint() function used everywhere else.
- No duplicated logic for "which bars are lit" — the same function and the same data source must handle manual slider input, the post-scan lock-on, and the initial render.
Want to tighten it up first? Run this prompt through the AI Prompt Studio to score it across 8 quality dimensions, catch anti-patterns, and tune the wording for Claude, ChatGPT, or Gemini before you paste it in.
Step by step
How to Use
- 1Paste HTML, CSS, and JSFive bars render with a strength label beneath them.
- 2Drag the strength sliderBars light up to the level and the color shifts from red to green.
- 3Read the labelThe text updates from No signal through Excellent to match the bars.
- 4Press simulate scanningThe bars sweep blue while the meter hunts for a signal.
- 5Wait for lock-onAfter a beat it stops and snaps to a random realistic strength.
- 6Map real dataConvert RSSI or connection type to 0–5 and call paint().
Real-world uses
Common Use Cases
Got questions?
Frequently Asked Questions
Each bar is a sibling span, and :nth-child selectors set their heights to 20%, 40%, 60%, 80%, and 100%. The container aligns them to the bottom with align-items:flex-end, so they form the familiar ascending signal shape using only five empty elements and CSS.
A LEVELS array maps each strength 0–5 to a name and a color. The paint() function reads one entry and applies it everywhere at once — lighting the bars, setting the --sig custom property, and writing the label text and aria-label — so the meter and the words always match.
It adds a .scanning class that runs a sigScan keyframe on each bar with an increasing animation-delay, producing a left-to-right blue sweep like a device searching. The slider is disabled during the scan, and a setTimeout ends it after about 2.2 seconds by snapping to a random realistic strength.
Yes. Map any metric — RSSI in dBm, the Network Information API effectiveType, or a latency bucket — onto a 0–5 level and call paint(). Since rendering is decoupled from the source, you can poll, listen to navigator.connection change events, or stream telemetry without changing the view.
Render the five bars from an array and add the lit class when the index is below the current level. Keep the level in state and derive the color and label from the LEVELS map. Put the scanning setTimeout in an effect and clear it on cleanup. In Tailwind, set bar colors via an inline style bound to the --sig value.