More Charts Snippets
Front-End Coding Playgrounds
Learn to code with interactive, live-preview playgrounds — HTML, CSS, JavaScript, React & more.
 HTML Playground42 lessons · Click-based · Live preview
 CSS PlaygroundLearn CSS with a live editor
 JavaScript Playground60 lessons · DOM · Async · Canvas
 React PlaygroundLearn React with a live code editor
 GSAP PlaygroundLearn GSAP animation interactively
 SVG Playground44 lessons · shapes · paths · animation
 SCSS Playground45 lessons · Sass modules · tokens
 Tailwind PlaygroundLearn Tailwind CSS with a live editor
 Bootstrap 5 Playground50 lessons · live preview
Gauge Chart HTML CSS JS — Animated SVG Speedometer
Gauge Chart · Charts · Plain HTML, CSS & JS · Live preview
What's included
Features
About this UI Snippet
Gauge Chart — Animated SVG Speedometer with Needle, Color Zones, and requestAnimationFrame Counter
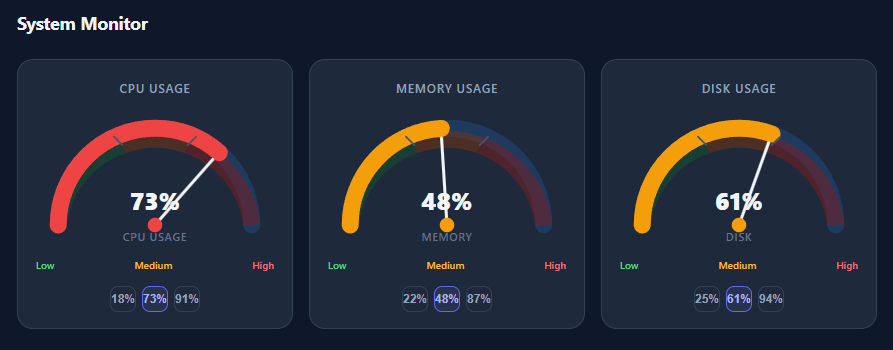
The gauge chart — also called a speedometer chart, dial chart, or tachometer — is one of the most effective data visualizations for threshold-based metrics. Unlike a raw number or a progress bar, a gauge communicates context instantly: is this reading in the safe zone, the caution zone, or the danger zone? The semicircle arc, rotating needle, and color bands mimic real-world instruments that every user already understands from car dashboards, appliances, and wearable devices.
This snippet builds a three-gauge system monitor dashboard (CPU Usage, Memory Usage, Disk Usage) entirely in SVG, CSS, and vanilla JavaScript — no Chart.js, no D3.js, no Canvas, no external dependencies. Understanding how it works requires three distinct areas: SVG arc geometry, the stroke-dasharray fill technique, and CSS transform-based needle animation.
SVG Arc Geometry and the Path A Command
Every gauge is a semicircle rendered with an SVG <path> element using the arc command: M x1 y1 A rx ry x-rotation large-arc-flag sweep-flag x2 y2. The specific path d="M 20 100 A 80 80 0 0 1 180 100" breaks down as: start point (20, 100) — the left end of the semicircle, which is center-x (100) minus radius (80); end point (180, 100) — center-x plus radius; radii 80 80 for a circle; x-rotation 0; large-arc-flag 0 for the shorter arc; sweep-flag 1 for clockwise direction. Together this draws the upper semicircle from left to right across the viewBox.
The SVG viewBox is set to "0 0 200 120" — 200 units wide, 120 tall. Center is at (100, 100) with 20px padding on each side and 20px of space below center for the flat base. The gauge arc spans the full width from x=20 to x=180.
Color Zone Arcs
Rather than computing zone boundaries mathematically at render time, the snippet uses three pre-drawn arc path elements as a permanent background layer. .zone-low covers the left third (0–33%), .zone-mid the center third, and .zone-high the right third. Each is a separate <path> with a distinct stroke color (dark green, amber, dark red) and opacity 0.5, sitting behind the progress fill arc and providing a constant visual reference for threshold zones. Tick mark <line> elements at the two zone boundaries angle outward from the arc edge to give precise visual dividers.
The stroke-dasharray Fill Technique
The progress fill is the same full semicircle path, but uses stroke-dasharray to reveal only the filled portion. The total arc length of a semicircle with radius 80 is π × 80 ≈ 251.3 pixels — stored as ARC_CIRCUMFERENCE = Math.PI * R.
To show a gauge at 73%, the code sets: stroke-dasharray: "183.9 68.4" — a 183.9px dash (73% × 251.3) followed by a 68.4px gap. The CSS transition transition: stroke-dashoffset 0.85s cubic-bezier(0.4, 0, 0.2, 1) on .gauge-fill animates the fill change. The cubic-bezier produces a Material Design ease-out: fast initial movement, gentle deceleration. This is the same technique used by every SVG progress ring and circular chart on the web, generalized here to a semicircle.
The Needle: CSS Transform Rotation Without a JS Tween
The needle is an SVG <g> group element containing a <line> from center (100,100) to top (100,28) and a <circle> hub. The group has style="transform-origin:100px 100px" inline — pinning rotation to the SVG center point. The CSS class .needle-group declares the same transition as the fill arc. When JavaScript sets needleEl.style.transform = \rotate(${angle}deg)\``, the browser handles the smooth rotation entirely via CSS — no JavaScript animation loop for the needle movement itself.
needleAngle(pct) maps 0–100% to −90°–+90°: −90 + pct × 180. At 0% the needle points left (−90°). At 50% it points straight up (0°). At 100% it points right (+90°), covering the full 180° span of the semicircle.
The Double-rAF Initialization Pattern
On page load, gauges should appear at their starting values instantly — no animation from 0%. The initGauges() function uses a specific three-step pattern: (1) set fillEl.style.transition = 'none' and needleEl.style.transition = 'none' to disable transitions; (2) call updateGauge() to render the starting state; (3) restore transitions inside requestAnimationFrame(() => requestAnimationFrame(() => { fillEl.style.transition = ''; })).
A single requestAnimationFrame is insufficient — the browser may batch style computations and apply the transition before the initial paint completes. Two nested rAF calls guarantee the restore happens after at least one committed paint frame. This double-rAF pattern is the standard solution for "set initial value without triggering the enter animation" and appears in production component libraries including React Transition Group.
requestAnimationFrame Counter Animation
The center value <text> element shows the numeric percentage. When a gauge updates, animateCounter(el, from, to, duration) counts from the old value to the new value over 850ms using quadratic ease-in-out: t < 0.5 ? 2t² : −1 + (4−2t)t. This easing mirrors the needle and arc CSS transitions, making the number, arc, and needle feel synchronized.
Each call creates its own closure over from, to, and start (from performance.now()). Multiple counters can run simultaneously without conflict. The loop calls requestAnimationFrame(step) until t >= 1, then stops — no cleanup needed.
Multi-Gauge Composition and DOM Conventions
The three gauges follow a consistent id convention: fill-{id}, needle-{id}, and val-{id}. The updateGauge(id, value, animate) function locates elements via document.getElementById('fill-' + id). Adding a fourth gauge requires only: a new HTML gauge-card with matching ids, and a new entry in the GAUGES object. The grid uses CSS Grid repeat(3, 1fr) with a max-width: 600px responsive single-column fallback via a @media query.
Connecting to Live Data
Replace the preset buttons with: setInterval(async () => { const { cpu, memory, disk } = await fetch('/api/metrics').then(r => r.json()); updateGauge('cpu', cpu, true); updateGauge('memory', memory, true); updateGauge('disk', disk, true); }, 5000). For WebSocket push: ws.onmessage = e => { const d = JSON.parse(e.data); updateGauge(d.id, d.value, true); }. The animation system handles rapid updates — calling updateGauge mid-animation simply updates the target, restarting from the current visual position.
Build with AI
Build, Understand, Optimize, and Extend It With AI
You don't have to derive the arc trigonometry from scratch to trust it. Paste this snippet's HTML, CSS, and JS into an AI coding assistant like Claude and ask it to explain exactly how describeArc computes the start and end points from the percentage using cosine and sine, and why the double-nested requestAnimationFrame in initGauges is necessary to avoid an unwanted animate-from-zero effect on first paint. The same assistant can help optimize it — ask whether the needleAngle and getColor functions could be unified into one config object per gauge instead of three separate parallel functions, and whether the quadratic ease-in-out counter animation is redundant given the CSS transition already handles the needle and arc. It's also useful for extending the chart: ask it to change the arc span from a semicircle to 270 degrees, wire updateGauge to a live WebSocket feed with reconnect handling, or add a fourth gauge for network throughput that reuses all the existing math unchanged. Treat the code less like a finished artifact and more like a starting point for a conversation.
Prompt to recreate it
Copy this into your AI assistant of choice to build the effect from scratch, or as a jumping-off point for your own variant:
Build an animated SVG gauge chart (speedometer) in plain HTML, CSS, and JavaScript using arc trigonometry and the stroke-dasharray technique — no charting library, no canvas.

Requirements:
- A semicircular SVG path drawn with the arc command, spanning exactly 180 degrees between a fixed center point and radius, representing the gauge's background track, with a matching full-length progress arc path layered on top of it.
- A function that converts a percentage value into an SVG arc path string (or dasharray value) using cosine and sine to compute the arc's endpoint coordinates from the center, radius, and the angle corresponding to that percentage — not a hardcoded set of preset paths.
- Reveal only the correct fraction of the progress arc using the stroke-dasharray technique: compute the arc's total circumference once (pi times radius for a semicircle), then set the dash length to the target percentage times that circumference and the gap to the remainder.
- A separate needle element (a line plus a circular hub) grouped so it rotates around the gauge's exact center point via a CSS transform, with its rotation angle computed as a linear mapping from the value percentage to a rotation range spanning the full arc (for example negative 90 degrees at 0 percent to positive 90 degrees at 100 percent).
- Both the arc fill and the needle rotation must use CSS transitions (not a JavaScript animation loop) so the browser interpolates the visual change smoothly whenever the underlying value updates.
- On initial page load, gauges must appear immediately at their starting values with no animation playing in from zero — implement this by temporarily disabling the relevant CSS transitions, setting the initial values, and then re-enabling the transitions only after the browser has had a chance to paint that initial state (using nested requestAnimationFrame calls, not a single one).
- Color the arc and needle hub based on the current value using at least three threshold bands (e.g. safe, caution, danger), and animate the numeric center label by counting up or down between the previous and new value over a fixed duration using an eased requestAnimationFrame loop.
- Support at least three independently updatable gauges on the same page sharing one update function, driven by an id-based naming convention so adding a new gauge requires no changes to the core update logic.
Step by step
How to Use
- 1Load the dashboardThree gauges render instantly at their starting values — CPU at 73%, Memory at 48%, Disk at 61%. No loading animation because the double-rAF init pattern sets values before transitions are enabled.
- 2Click a preset buttonClick Low, Medium, or High beneath any gauge. The needle rotates, the arc fill animates, and the center counter counts up or down — all three synchronized via the same cubic-bezier easing.
- 3Read the color zonesThe arc background shows three bands: green (0–33%), amber (33–66%), red (66–100%). The fill arc and needle hub color update automatically via getColor(pct) based on the new value.
- 4Call updateGauge() from your codeCall updateGauge('cpu', 91, true) from anywhere to update a gauge programmatically. The second argument is the new percentage (0–100). The third enables animation.
- 5Feed live API dataWrap updateGauge() in a setInterval with a fetch call to your metrics endpoint. The animation handles any update frequency — multiple rapid updates restart from the current visual position.
- 6Add or customize gaugesCopy a gauge-card HTML block, assign matching ids (fill-X, needle-X, val-X), add an entry to the GAUGES object, and update the grid-template-columns count. No core functions need changing.
Real-world uses
Common Use Cases
Got questions?
Frequently Asked Questions
The gauge-fill path is drawn as the full semicircle. ARC_CIRCUMFERENCE = Math.PI * R (≈251.3px for radius 80) is the total stroke length of that path. Setting stroke-dasharray to "183.9 68.4" creates a dash of 183.9px (73% × 251.3) followed by a 68.4px gap. SVG draws that dash along the path, so 73% of the arc is stroked and the rest is invisible. CSS transition: stroke-dashoffset animates the change smoothly when you update the dasharray values.
The needle group has transform-origin: 100px 100px (the SVG center) set inline, and CSS transition: transform 0.85s cubic-bezier(0.4,0,0.2,1) in the stylesheet. JavaScript just sets needleEl.style.transform = rotate(${angle}deg). The browser handles the smooth interpolation entirely via CSS — no requestAnimationFrame loop, no JS tween, no animation library needed.
Change ARC_CIRCUMFERENCE to 1.5 * Math.PI * R. Update the hardcoded path d values for the background track and color zone arcs to span 270°. In describeArc(), change the startAngle from Math.PI to 2.356 (135°) and the full sweep from Math.PI to 4.712 (270°). Also update needleAngle() — for 270° span: -135 + pct * 270 — and set transform-origin to the new SVG center.
One rAF fires before the browser paints but after style computation. If transitions are restored after one rAF, the browser may still apply the transition to the just-set value and animate from 0%. Two nested rAF calls guarantee the first paint has completed and the browser has committed the no-transition state to screen before transitions are restored. This is the standard fix for "set initial state without triggering entry animation."
const ws = new WebSocket('wss://your-api/metrics'); ws.onmessage = e => { const { id, value } = JSON.parse(e.data); updateGauge(id, value, true); }; The id must match a key in the GAUGES object ('cpu', 'memory', 'disk'). The animation system handles rapid updates — calling updateGauge while an animation is running restarts the counter from its current displayed value, preventing any jump.
Yes. Use the JSX, Vue, Angular, or Tailwind export buttons on this page. In React, pass the gauge value as a prop and compute the needle rotation and arc dashoffset from it during render — the CSS transition animates the change automatically, no imperative animation code needed.