Learn Coding Visually
Learn to code with interactive, live-preview playgrounds — HTML, CSS, JavaScript, React & more.
 HTML Playground42 lessons · Click-based · Live preview
 CSS PlaygroundLearn CSS with a live editor
 JavaScript Playground60 lessons · DOM · Async · Canvas
 React PlaygroundLearn React with a live code editor
 GSAP PlaygroundLearn GSAP animation interactively
 SVG Playground44 lessons · shapes · paths · animation
 SCSS Playground45 lessons · Sass modules · tokens
 Tailwind PlaygroundLearn Tailwind CSS with a live editor
 Bootstrap 5 Playground50 lessons · live preview
Gantt Chart Table — Free HTML CSS JS Snippet
Gantt Chart Table · Tables · Plain HTML, CSS & JS · Live preview
What's included
Features
About this UI Snippet
Gantt Chart Table — CSS Grid Layout, Horizontal Bars, Month Dividers & Today Indicator
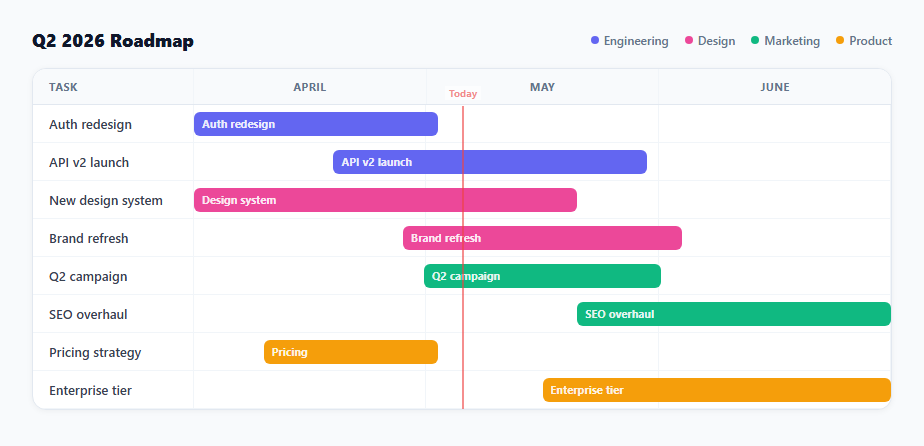
A Gantt chart table visualises project tasks as horizontal bars across a timeline, making it easy to see task durations, overlaps, and the overall project schedule at a glance. This snippet provides a complete CSS-based Gantt chart without any chart library: a two-column CSS Grid (task labels + bar area), horizontal bars positioned with left and width percentages, three-column month dividers via repeating-linear-gradient grid lines, colour-coded bars per team, and a JavaScript-positioned "Today" indicator line.
The CSS Grid layout
The gantt-grid uses display: grid; grid-template-columns: 160px 1fr. The left column is a fixed 160px for task labels; the right column fills the remaining space for the bar chart area. Each row pair (label + bars) repeats the two-column pattern. The header row uses .g-label-head and .g-months, which itself uses grid-template-columns: repeat(3,1fr) to show three equal-width month columns.
Horizontal bar positioning
Each .g-bar uses position: absolute within a position: relative .g-bars container. The left CSS property positions the bar's start as a percentage of the container width. The width property controls the bar's duration as a percentage. For a 3-month view (90 days): a task starting on April 20 (day 20 of 90) has left: 20/90*100 ≈ 22%. A task lasting 40 days has width: 40/90*100 ≈ 44%. The data-tip attributes hold human-readable date labels for tooltips.
Month column gridlines
The .g-bars background uses repeating-linear-gradient(90deg, transparent, transparent calc(33.33% - 1px), #f1f5f9 calc(33.33% - 1px), #f1f5f9 33.33%). This draws a 1px grey line at every 33.33% (one-third = one month of three) purely in CSS — no extra HTML elements needed for the vertical grid lines.
The today indicator line
A JavaScript snippet computes the current date's position within the Q2 range (April 1 – June 30). If today falls within the range, the percentage through the quarter is computed and the today-line div is positioned accordingly. The line has a red background and a ::before pseudo-element showing "Today" as a label above it.
Colour-coded bars by team
Engineering bars use indigo, Design uses pink, Marketing uses green, Product uses amber. The legend at the top maps each colour to its team. This visual separation lets viewers scan which team is responsible for each task without reading the label.
Build with AI
Build, Understand, Optimize, and Extend It With AI
You don't have to work out the percentage math by hand. Paste this snippet's HTML, CSS, and JS into an AI coding assistant like Claude and ask it to explain exactly how the repeating-linear-gradient on the bars container draws the month gridlines at precisely 33.33% intervals without any extra DOM elements, and why the today-line's left offset uses a calc() expression combining a fixed 160px with a percentage of the remaining width rather than a single percentage value. The same assistant can help optimize it — ask whether computing each bar's left and width from raw dates on every render is worth memoizing once tasks come from a real API instead of hardcoded inline styles, or whether the grid-template-columns fixed-160px approach holds up with much longer task labels. It's also useful for extending the chart: have it add dependency arrows between related tasks drawn with an absolutely-positioned SVG overlay, a zoom toggle between month and week views, or drag-to-resize on the bars themselves to adjust task duration interactively. Treat the code less like a finished artifact and more like a starting point for a conversation.
Prompt to recreate it
Copy this into your AI assistant of choice to build the effect from scratch, or as a jumping-off point for your own variant:
Build a Gantt chart as a CSS Grid table in plain HTML, CSS, and JavaScript — no chart library, no canvas or SVG for the bars themselves.

Requirements:
- A two-column CSS Grid layout: a fixed-width label column on the left and a flexible bar-area column on the right, repeated for a header row (task label header plus month headers in their own sub-grid of equal columns) followed by one label/bar-area row pair per task.
- Each task's bar must be an absolutely-positioned element inside a relatively-positioned bar-area container, with its left offset and width expressed as percentages representing, respectively, how far into the total date range the task starts and what fraction of the total range its duration spans.
- Draw the vertical month-boundary gridlines behind the bars using only a CSS repeating-linear-gradient background on the bar-area container (computing the correct repeat interval for the number of month columns), not extra divs or an SVG grid.
- Compute today's position as a percentage of the overall date range in JavaScript by comparing the current date against a defined range-start and range-end, and position a vertical "today" indicator line at that percentage — but expressed relative to the bar-area only, meaning the line's actual left offset must account for the fixed-width label column in addition to the percentage into the bar area. Do not render the line at all if today falls outside the defined range.
- Give every bar a data attribute holding a human-readable date range and color-code bars by team/category, with a legend mapping each color to its team.
- Make the whole table horizontally scrollable on narrow viewports by giving the grid a sensible minimum width inside an overflow-x auto container, without breaking the today-line's percentage-based positioning.
Want to tighten it up first? Run this prompt through the AI Prompt Studio to score it across 8 quality dimensions, catch anti-patterns, and tune the wording for Claude, ChatGPT, or Gemini before you paste it in.
Source Code
<div class="wrap">
  <div class="gantt-head">
    <h2 class="g-title">Q2 2026 Roadmap</h2>
    <div class="legend">
      <span class="leg-item"><span class="leg-dot" style="background:#6366f1"></span>Engineering</span>
      <span class="leg-item"><span class="leg-dot" style="background:#ec4899"></span>Design</span>
      <span class="leg-item"><span class="leg-dot" style="background:#10b981"></span>Marketing</span>
      <span class="leg-item"><span class="leg-dot" style="background:#f59e0b"></span>Product</span>
    </div>
  </div>

  <div class="gantt-scroll">
    <div class="gantt-grid">

      <!-- Header row -->
      <div class="g-label-head">Task</div>
      <div class="g-months">
        <div class="g-month">April</div>
        <div class="g-month">May</div>
        <div class="g-month">June</div>
      </div>

      <!-- Rows -->
      <div class="g-label">Auth redesign</div>
      <div class="g-bars">
        <div class="g-bar" style="left:0%;width:35%;background:#6366f1" data-tip="Apr 1 – May 7">
          <span class="bar-label">Auth redesign</span>
        </div>
      </div>

      <div class="g-label">API v2 launch</div>
      <div class="g-bars">
        <div class="g-bar" style="left:20%;width:45%;background:#6366f1" data-tip="Apr 20 – May 31">
          <span class="bar-label">API v2 launch</span>
        </div>
      </div>

      <div class="g-label">New design system</div>
      <div class="g-bars">
        <div class="g-bar" style="left:0%;width:55%;background:#ec4899" data-tip="Apr 1 – May 21">
          <span class="bar-label">Design system</span>
        </div>
      </div>

      <div class="g-label">Brand refresh</div>
      <div class="g-bars">
        <div class="g-bar" style="left:30%;width:40%;background:#ec4899" data-tip="Apr 30 – May 31">
          <span class="bar-label">Brand refresh</span>
        </div>
      </div>

      <div class="g-label">Q2 campaign</div>
      <div class="g-bars">
        <div class="g-bar" style="left:33%;width:34%;background:#10b981" data-tip="May 1 – Jun 4">
          <span class="bar-label">Q2 campaign</span>
        </div>
      </div>

      <div class="g-label">SEO overhaul</div>
      <div class="g-bars">
        <div class="g-bar" style="left:55%;width:45%;background:#10b981" data-tip="May 21 – Jun 30">
          <span class="bar-label">SEO overhaul</span>
        </div>
      </div>

      <div class="g-label">Pricing strategy</div>
      <div class="g-bars">
        <div class="g-bar" style="left:10%;width:25%;background:#f59e0b" data-tip="Apr 10 – May 2">
          <span class="bar-label">Pricing</span>
        </div>
      </div>

      <div class="g-label">Enterprise tier</div>
      <div class="g-bars">
        <div class="g-bar" style="left:50%;width:50%;background:#f59e0b" data-tip="May 17 – Jun 30">
          <span class="bar-label">Enterprise tier</span>
        </div>
      </div>

    </div>

    <!-- Today line -->
    <div class="today-line" id="today-line" title="Today"></div>
  </div>
</div>
* { box-sizing: border-box; margin: 0; padding: 0; }
body { font-family: system-ui, sans-serif; background: #f8fafc; min-height: 100vh; padding: 28px 20px; }
.wrap { max-width: 860px; margin: 0 auto; }
.gantt-head { display: flex; justify-content: space-between; align-items: center; margin-bottom: 16px; flex-wrap: wrap; gap: 12px; }
.g-title { font-size: 18px; font-weight: 800; color: #0f172a; }
.legend { display: flex; gap: 16px; flex-wrap: wrap; }
.leg-item { display: flex; align-items: center; gap: 5px; font-size: 12px; color: #64748b; font-weight: 500; }
.leg-dot { width: 8px; height: 8px; border-radius: 50%; }
.gantt-scroll { position: relative; overflow-x: auto; background: #fff; border-radius: 14px; border: 1px solid #e2e8f0; box-shadow: 0 1px 6px rgba(0,0,0,0.05); }
.gantt-grid { display: grid; grid-template-columns: 160px 1fr; min-width: 600px; }
/* Header */
.g-label-head { padding: 10px 16px; font-size: 11px; font-weight: 700; text-transform: uppercase; letter-spacing: 0.5px; color: #64748b; border-bottom: 1px solid #e2e8f0; background: #f8fafc; }
.g-months { display: grid; grid-template-columns: repeat(3, 1fr); border-bottom: 1px solid #e2e8f0; background: #f8fafc; }
.g-month { padding: 10px 0; font-size: 11px; font-weight: 700; text-transform: uppercase; letter-spacing: 0.5px; color: #64748b; text-align: center; border-left: 1px solid #f1f5f9; }
/* Task rows */
.g-label { padding: 10px 16px; font-size: 13px; font-weight: 600; color: #374151; border-bottom: 1px solid #f1f5f9; display: flex; align-items: center; }
.gantt-grid > .g-label:last-of-type { border-bottom: none; }
.g-bars { position: relative; padding: 6px 0; border-bottom: 1px solid #f1f5f9; border-left: 1px solid #f1f5f9; background: repeating-linear-gradient(90deg, transparent, transparent calc(33.33% - 1px), #f1f5f9 calc(33.33% - 1px), #f1f5f9 33.33%); }
.g-bar { position: absolute; height: 24px; border-radius: 6px; top: 50%; transform: translateY(-50%); display: flex; align-items: center; padding: 0 8px; cursor: default; transition: filter 0.15s; }
.g-bar:hover { filter: brightness(1.1); }
.bar-label { font-size: 11px; font-weight: 700; color: rgba(255,255,255,0.9); white-space: nowrap; overflow: hidden; text-overflow: ellipsis; max-width: 100%; }
/* Today line */
.today-line { position: absolute; top: 37px; bottom: 0; width: 2px; background: #ef4444; opacity: 0.6; pointer-events: none; left: 50%; }
.today-line::before { content: 'Today'; position: absolute; top: -20px; left: 50%; transform: translateX(-50%); font-size: 10px; font-weight: 700; color: #ef4444; white-space: nowrap; background: #fff; padding: 0 4px; }// Position the "Today" line based on actual date within the Q2 range
const Q2_START = new Date('2026-04-01');
const Q2_END = new Date('2026-06-30');
const today = new Date();
if (today >= Q2_START && today <= Q2_END) {
const pct = (today - Q2_START) / (Q2_END - Q2_START) * 100;
// Today line is within the bars area (from the 160px label column)
const line = document.getElementById('today-line');
// The bars area starts after .g-label-head which is 160px wide
// Position relative to the bars column: left% of bars area
line.style.left = 'calc(160px + ' + pct.toFixed(1) + '% * (100% - 160px) / 100)';
}Step by step
How to Use
- 1Review the Gantt chart and today lineThe chart shows 8 tasks across a 3-month quarter. The red "Today" line positions itself based on the current date within the April–June range. If today is outside the range, the line does not appear.
- 2Update task names and bar positionsEdit each .g-label div text for the task name. Update the .g-bar style: left% is the task start as a percentage of the total period; width% is the task duration as a percentage. Add data-tip for a human-readable date range.
- 3Add or remove task rowsEach task is a pair of divs: .g-label and .g-bars. Duplicate both divs to add a new task row. Delete both to remove one. The grid auto-expands vertically for new rows.
- 4Change the time rangeUpdate Q2_START and Q2_END in the JS to your project start and end dates. Update the month headers in .g-months. Recalculate bar left and width percentages as (taskStart - rangeStart) / rangeDuration * 100.
- 5Add a tooltip on bar hoverEach .g-bar has data-tip="Apr 1 – May 7". Add a mouseover listener: document.querySelectorAll(".g-bar").forEach(b => b.title = b.dataset.tip). Or implement a custom tooltip using the CSS Tooltip snippet.
- 6Export in your formatClick "HTML" for a standalone file, "JSX" for a React component mapping a tasks array to bar divs, or "Tailwind" for a Tailwind CSS version.
Real-world uses
Common Use Cases
Got questions?
Frequently Asked Questions
First define your range: const rangeStart = new Date("2026-04-01"); const rangeDays = 91 (April-June = 91 days). For each task: const taskStart = new Date(task.startDate); const taskDuration = task.durationDays; const left = (taskStart - rangeStart) / (86400000 * rangeDays) * 100; const width = taskDuration / rangeDays * 100. Apply these as inline styles: bar.style.left = left.toFixed(1) + "%"; bar.style.width = width.toFixed(1) + "%".
Add an SVG overlay on top of the .gantt-scroll with position:absolute; inset:0; pointer-events:none. For each dependency, draw an SVG path from the right edge of the predecessor bar to the left edge of the successor bar. The path can be a simple elbow: M x1 y1 L x2 y1 L x2 y2 L x3 y2 where x1/y1 is the predecessor end and x3/y2 is the successor start. This requires JavaScript to compute bar positions from the DOM.
The .gantt-scroll already has overflow-x: auto. For a 12-month view, change .g-months to grid-template-columns: repeat(12,1fr) and update the month labels. Change the repeating-linear-gradient to 8.33% (1/12). Set a minimum width on .gantt-grid: min-width: 1200px. Bar percentages automatically span the correct portion of the 12-month view.
Click "JSX" to download. Define a tasks array: [{name, team, start, end, color}]. Define rangeStart and rangeEnd dates. Compute left and width for each task with useMemo. Map tasks to pairs of label div + bar div. Compute the today line position in a useEffect that runs once on mount. For dependencies, manage them as a separate array of {from, to} task index pairs.