You Might Also Like
Learn Coding Visually
Learn to code with interactive, live-preview playgrounds — HTML, CSS, JavaScript, React & more.
 HTML Playground42 lessons · Click-based · Live preview
 CSS PlaygroundLearn CSS with a live editor
 JavaScript Playground60 lessons · DOM · Async · Canvas
 React PlaygroundLearn React with a live code editor
 GSAP PlaygroundLearn GSAP animation interactively
 SVG Playground44 lessons · shapes · paths · animation
 SCSS Playground45 lessons · Sass modules · tokens
 Tailwind PlaygroundLearn Tailwind CSS with a live editor
 Bootstrap 5 Playground50 lessons · live preview
GitHub-Style Contribution Heatmap — Free HTML CSS JS Calendar Snippet
GitHub-Style Contribution Heatmap · Dev · Plain HTML, CSS & JS · Live preview
What's included
Features
About this UI Snippet
Contribution Heatmap — CSS Grid Calendar with Level-Based Color Coding
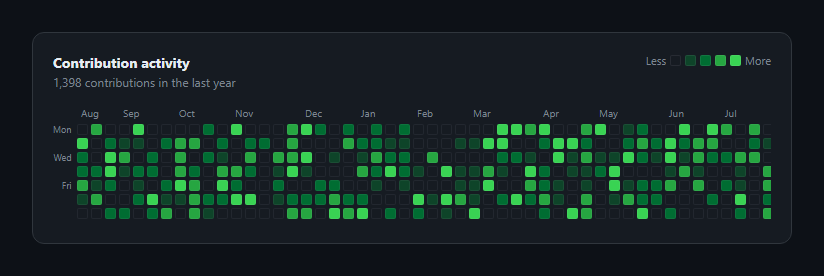
A contribution heatmap turns a year of daily activity counts into a single scannable grid, the pattern popularized by GitHub's profile page and now common on habit trackers, analytics dashboards, and streak-tracking apps. This snippet builds the full grid, color scale, and hover tooltip from scratch using CSS Grid and vanilla JavaScript — no charting library required.
Building the date grid
The script computes a 53-week window ending today, then rewinds start to the previous Sunday with start = new Date(start.getTime() - start.getDay() * DAY) so every week lands cleanly into 7 rows. It then walks forward one day at a time, pushing { date, count } objects into a flat days array — day 0 is the top-left cell, day 6 wraps to the next column, matching how grid-auto-flow: column lays cells out.
CSS Grid does the calendar layout
.chm-grid uses grid-template-rows: repeat(7, 11px) with grid-auto-flow: column, so pushing 371 cells in date order automatically arranges them into weeks-as-columns without any manual row/column math in JavaScript — the grid algorithm handles wrapping every 7 cells into a new column for you.
A five-level, not continuous, color scale
Rather than mapping raw counts to color via hsl() interpolation, levelFor() buckets counts into five discrete tiers (0, 1–2, 3–5, 6–10, 11+) matching GitHub's actual convention. Discrete levels read faster at a glance than a continuous gradient because the eye only has to distinguish five states, not infinite shades — each level maps to a fixed data-level attribute and a corresponding CSS background color.
Month labels aligned to grid columns
As the loop walks days, it detects a Sunday that starts a new month (dow === 0 && d.date.getMonth() !== lastMonthLabel) and appends a label positioned with style.gridColumn = weekIndex + 1, keeping the month row's labels aligned to the exact week column they belong to even though months don't divide evenly into 53 weeks.
A tooltip that follows the cursor
Each cell gets mouseenter/mousemove/mouseleave listeners that show a fixed-position tooltip offset from e.clientX/e.clientY, formatted with toLocaleDateString() for a locale-correct date string — cheaper than a full tooltip library for a grid with hundreds of hoverable cells.
Customizing it
Swap the random data generator for a real fetch() call to your activity API, change WEEKS to show a shorter range, or adjust the levelFor() thresholds to match your own data's distribution.
Build with AI
Build, Understand, Optimize, and Extend It With AI
You don't have to work out the week-alignment math by hand. Paste this snippet's HTML, CSS, and JS into an AI coding assistant like Claude and ask it to explain why the start date gets rewound to the previous Sunday before the grid is built, and how grid-auto-flow: column turns a flat array of day cells into a calendar of weekly columns without manual row/column indexing. The same assistant can help optimize it too — ask whether building 371 DOM nodes up front is worth it versus a canvas-based render for very large date ranges. It's also useful for extending the heatmap: ask it to add a year selector, wire real data in from an API, or add keyboard navigation between cells for accessibility. Treat the code less like a finished artifact and more like a starting point for a conversation.
Prompt to recreate it
Copy this into your AI assistant of choice to build the effect from scratch, or as a jumping-off point for your own variant:
Build a "GitHub-style contribution heatmap" in plain HTML, CSS, and JavaScript with no charting library.

Requirements:
- A calendar grid covering the last 53 weeks ending today, laid out with CSS Grid using 7 fixed-height rows and grid-auto-flow set to column so pushing day cells in chronological order automatically wraps into weekly columns.
- Before building the grid, rewind the start date to the closest previous Sunday so every column represents a complete 7-day week with no partial first column.
- Generate a count for each day (or accept it from an external data source) and bucket that count into five discrete intensity levels using fixed thresholds, applying a different background color per level via a data attribute rather than a computed gradient.
- Month name labels positioned above the grid, aligned to the exact week column in which that month's first Sunday falls, computed by tracking which grid column index the loop is on when the month changes.
- A hover tooltip that follows the cursor and shows the exact count and a human-readable date for the cell being hovered, positioned relative to the mouse event coordinates.
- A small legend showing "Less" to "More" with sample swatches for each of the five levels, and a header summary line showing the total count across the whole grid.
- The grid must scroll horizontally inside its own container on narrow viewports without causing the page itself to scroll sideways.
Want to tighten it up first? Run this prompt through the AI Prompt Studio to score it across 8 quality dimensions, catch anti-patterns, and tune the wording for Claude, ChatGPT, or Gemini before you paste it in.
Step by step
How to Use
- 1Paste HTML, CSS, and JSA 53-week calendar grid renders with randomly generated activity levels and a color legend.
- 2Hover a cellA tooltip shows the exact contribution count and date for that day.
- 3Scroll horizontallyOn narrow viewports the grid scrolls inside its own container so the page never scrolls sideways.
- 4Replace the data sourceSwap the random count generator in the JS for a fetch() call returning real daily counts.
- 5Adjust the color levelsEdit levelFor() thresholds and the .chm-cell[data-level] CSS colors to match your brand palette.
- 6Change the time rangeEdit the WEEKS constant to show a shorter or longer history than 53 weeks.
Real-world uses
Common Use Cases
Got questions?
Frequently Asked Questions
CSS Grid's grid-auto-flow: column wraps every 7 cells into a new column. If the first day isn't a Sunday, the first week would be a partial column and every subsequent week would be visually misaligned. Rewinding start to the prior Sunday guarantees every column is a clean 7-day week.
Replace the days.push({ date, count }) loop with data fetched from your API — for example fetch('/api/activity').then(r => r.json()), where the response is an array of { date, count } objects covering the same date range. Keep the date objects normalized to midnight so day-of-week math stays correct.
levelFor(count) buckets the raw count into one of five tiers (0, 1, 2, 3, 4) using fixed thresholds. Each cell gets a data-level attribute, and the CSS selects a background color per level with .chm-cell[data-level="N"]. Edit the thresholds in levelFor() to fit your own data's typical range.
Yes — the cell.addEventListener block already wires up mouseenter/mousemove/mouseleave for the tooltip. Add a click listener in the same forEach loop that reads d.date and d.count and opens a modal, navigates to a detail page, or expands an inline panel.
A five-level scale is easier to read at a glance across hundreds of cells because the eye only has to distinguish five known states rather than judge a continuous gradient's exact shade. It also matches the convention most developers already recognize from GitHub, so no legend explanation is needed.