Source Code
<div class="ab-diagram" id="abDiagram">
  <svg class="ab-wires" id="abWires" aria-hidden="true"></svg>
  <div class="ab-col">
    <div class="ab-node" data-node="a">◐</div>
    <div class="ab-node" data-node="b">✉</div>
    <div class="ab-node" data-node="c">▤</div>
  </div>
  <div class="ab-col ab-center">
    <div class="ab-hub" data-node="hub">⬡</div>
  </div>
  <div class="ab-col">
    <div class="ab-node" data-node="d">☁</div>
    <div class="ab-node" data-node="e">⚡</div>
    <div class="ab-node" data-node="f">◔</div>
  </div>
</div>*{box-sizing:border-box;margin:0;padding:0}
body{font-family:system-ui,-apple-system,sans-serif;background:#0a0a14;color:#fff;display:flex;justify-content:center;align-items:center;min-height:100vh;padding:24px}
.ab-diagram{position:relative;width:100%;max-width:520px;display:flex;justify-content:space-between;align-items:center;gap:60px}
.ab-wires{position:absolute;inset:0;width:100%;height:100%;pointer-events:none;overflow:visible}
.ab-col{display:flex;flex-direction:column;gap:26px;z-index:1}
.ab-center{justify-content:center}
.ab-node,.ab-hub{display:flex;align-items:center;justify-content:center;border-radius:14px;background:#16162a;border:1px solid #2a2a44;font-size:22px;box-shadow:0 8px 24px -10px rgba(0,0,0,.6)}
.ab-node{width:50px;height:50px}
.ab-hub{width:74px;height:74px;font-size:34px;background:linear-gradient(160deg,#1e1b4b,#312e81);border-color:#4f46e5;box-shadow:0 0 0 1px rgba(99,102,241,.3),0 0 40px -6px rgba(99,102,241,.6)}
.ab-path{stroke:#2a2a44;stroke-width:2;fill:none}
.ab-flow{stroke-width:2.4;fill:none;stroke-linecap:round}var diagram = document.getElementById('abDiagram');
var svg = document.getElementById('abWires');
var SVGNS = 'http://www.w3.org/2000/svg';
var PAIRS = [['a','hub'],['b','hub'],['c','hub'],['d','hub'],['e','hub'],['f','hub']];
var COLORS = ['#6366f1','#ec4899','#22d3ee','#34d399','#fbbf24','#fb7185'];
function center(el) {
var r = el.getBoundingClientRect();
var d = diagram.getBoundingClientRect();
return { x: r.left - d.left + r.width / 2, y: r.top - d.top + r.height / 2 };
}
function curve(p1, p2) {
// A horizontal cubic bezier — control points pulled toward the hub midline.
var mx = (p1.x + p2.x) / 2;
return 'M' + p1.x + ' ' + p1.y + ' C ' + mx + ' ' + p1.y + ', ' + mx + ' ' + p2.y + ', ' + p2.x + ' ' + p2.y;
}
function build() {
svg.innerHTML = '';
// One gradient def per beam so each flowing dash has its own color glow.
var defs = document.createElementNS(SVGNS, 'defs');
svg.appendChild(defs);
PAIRS.forEach(function (pair, i) {
var a = diagram.querySelector('[data-node=' + pair[0] + ']');
var b = diagram.querySelector('[data-node=' + pair[1] + ']');
var d = curve(center(a), center(b));
var base = document.createElementNS(SVGNS, 'path');
base.setAttribute('d', d); base.setAttribute('class', 'ab-path');
svg.appendChild(base);
var flow = document.createElementNS(SVGNS, 'path');
flow.setAttribute('d', d); flow.setAttribute('class', 'ab-flow');
flow.setAttribute('stroke', COLORS[i]);
var len = base.getTotalLength();
// A short bright dash chasing along the wire = the "beam".
flow.setAttribute('stroke-dasharray', (len * 0.18) + ' ' + len);
flow.style.filter = 'drop-shadow(0 0 5px ' + COLORS[i] + ')';
flow.animate(
[{ strokeDashoffset: len }, { strokeDashoffset: -len * 0.18 }],
{ duration: 2200, delay: i * 320, iterations: Infinity, easing: 'linear' }
);
svg.appendChild(flow);
});
}
build();
window.addEventListener('resize', build);Learn Coding Visually
Learn to code with interactive, live-preview playgrounds — HTML, CSS, JavaScript, React & more.
 HTML Playground42 lessons · Click-based · Live preview
 CSS PlaygroundLearn CSS with a live editor
 JavaScript Playground60 lessons · DOM · Async · Canvas
 React PlaygroundLearn React with a live code editor
 GSAP PlaygroundLearn GSAP animation interactively
 SVG Playground44 lessons · shapes · paths · animation
 SCSS Playground45 lessons · Sass modules · tokens
 Tailwind PlaygroundLearn Tailwind CSS with a live editor
 Bootstrap 5 Playground50 lessons · live preview
Animated Beam — Free HTML CSS JS Integration Diagram Snippet
Animated Beam · Animations · Plain HTML, CSS & JS · Live preview
What's included
Features
About this UI Snippet
Animated Beam — Flowing Light Wires Into a Central Hub
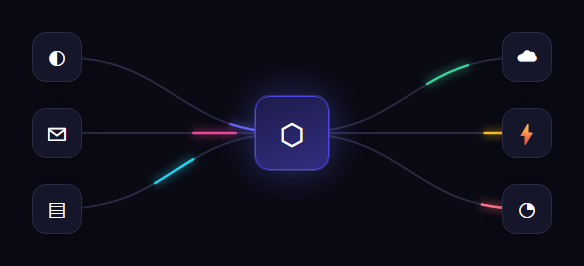
The animated beam is the integration-diagram pattern made famous by developer platforms: a grid of service icons connected to a central hub by curved wires, with pulses of light flowing along each wire toward the center — visualizing data, events, or integrations converging on your product. This snippet builds it with plain HTML, CSS, and vanilla JavaScript using SVG, and it auto-routes the wires by measuring the actual node positions, so it stays correct at any size.
Measuring real node positions
Rather than hard-coding coordinates, the script reads each node's position from the live layout. center(el) uses getBoundingClientRect for both the node and the diagram container and returns the node's center relative to the container. This means you lay out the icons with normal flexbox, and the wires connect to wherever they actually land — change the spacing, add nodes, or resize the window and the beams follow.
Curved connectors with cubic beziers
Each wire is an SVG path built by curve(p1, p2), which draws a cubic bezier between two node centers. The control points share the midpoint x but keep each endpoint's y, producing a smooth horizontal S-curve that eases out of one node and into the other — far more elegant than a straight line, and the standard look for these diagrams. A muted gray base path is drawn first so the wire is visible even between pulses.
The beam itself: a chasing dash
The flowing light is a clever use of stroke-dasharray and stroke-dashoffset. The animated path's dash array is set to one short bright segment (18% of the wire's length, measured with getTotalLength) followed by a gap as long as the whole wire. Animating stroke-dashoffset from the full length down to negative the dash length slides that single bright segment from one end of the wire to the other — a packet of light traveling the path. A colored drop-shadow filter gives it a glow.
Staggered, infinite, per-color beams
Each of the six wires gets its own color and its own beam, animated with the Web Animations API (element.animate) at iterations: Infinity. A per-wire delay of i * 320ms staggers them so the pulses don't all fire in lockstep — they ripple into the hub in sequence, which looks alive rather than robotic. Using animate() keeps each beam's timing self-contained without managing CSS classes or keyframe names.
The glowing hub
The center node is larger and styled with a layered box-shadow — an inner ring plus a soft outer glow — so it reads as the powered destination all the beams flow into. The side nodes are neutral tiles, keeping the visual hierarchy clear: many sources, one hub.
Responsive re-routing
Because the wires are derived from measured positions, a resize listener simply calls build() again, which clears the SVG and recomputes every path and beam for the new layout. There's no separate mobile version to maintain — the diagram re-routes itself.
Customizing it
Swap the node glyphs for real logo SVGs, edit the PAIRS array to change which nodes connect (you can chain nodes, not just hub-and-spoke), recolor the beams, and tune the dash length, duration, and stagger. Reverse the strokeDashoffset animation to flow outward from the hub instead. Pair it with a feature tabs showcase or an integration cards grid to explain how your product connects.
Build with AI
Build, Understand, Optimize, and Extend It With AI
You don't have to work through the coordinate geometry by hand — paste this snippet's HTML, CSS, and JS into an AI coding assistant like Claude and ask it to explain exactly how getBoundingClientRect is used to convert each node's viewport position into diagram-relative coordinates, and how the stroke-dasharray/stroke-dashoffset combination in the flow paths produces a single traveling dash rather than a fully-drawn line. The same assistant is useful for optimizing it — asking whether rebuilding every SVG path from scratch on every resize event is expensive enough to need debouncing, and whether the six independent Web Animations API calls could be consolidated. It's just as good for extending the diagram: ask it to support many-to-many connections instead of hub-and-spoke by generalizing the PAIRS array, reverse the flow direction outward from the hub, or replace the glyph placeholders with real inline logo SVGs while keeping the auto-routing intact. Treat the code less like a finished artifact and more like a starting point for a conversation.
Prompt to recreate it
Copy this into your AI assistant of choice to build the effect from scratch, or as a jumping-off point for your own variant:
Build an "animated beam" integration diagram in plain HTML, CSS, and JavaScript using SVG paths and the Web Animations API — no charting or diagramming library, no hardcoded pixel coordinates.

Requirements:
- A set of icon "node" elements laid out with ordinary flexbox (some on the left, some on the right, one larger central "hub" node in the middle), plus an absolutely-positioned SVG overlay covering the same area for drawing connector wires.
- Do not hardcode any coordinates for the wires. Instead, write a function that takes a node element, calls getBoundingClientRect on both that node and the diagram container, and returns the node's center point in coordinates relative to the container — so the wires are always derived from the real rendered layout.
- Connect each side node to the hub with a cubic bezier SVG path whose control points share the horizontal midpoint between the two node centers but keep each node's own vertical position, producing a smooth S-curve rather than a straight line.
- For every connection, draw two paths: a static, muted, low-opacity base path (always visible) and a second "flow" path in a distinct color per connection, whose stroke-dasharray is set to one short segment (a fraction of the path's total length, measured via getTotalLength) followed by a gap equal to the full path length.
- Animate each flow path's stroke-dashoffset from the full path length down to the negative of the dash-segment length, using the Web Animations API's element.animate with infinite iterations and linear easing, so a single bright segment appears to travel continuously along the wire from source to hub. Give each flow path a colored drop-shadow filter matching its stroke color for a glow effect.
- Stagger the six (or however many) connections' animation start times with a per-index delay so the pulses ripple into the hub in sequence rather than firing in lockstep, and re-run the entire path-building function on window resize so the wires stay correctly routed at any viewport size.
Want to tighten it up first? Run this prompt through the AI Prompt Studio to score it across 8 quality dimensions, catch anti-patterns, and tune the wording for Claude, ChatGPT, or Gemini before you paste it in.
Step by step
How to Use
- 1Paste HTML, CSS, and JSSix icons connect to a glowing central hub with curved wires.
- 2Watch the beamsPulses of colored light flow along each wire into the hub.
- 3Note the staggerThe beams ripple in sequence rather than all at once.
- 4Resize the windowThe wires re-route automatically to the new positions.
- 5Swap in real logosReplace the node glyphs with your integration SVGs.
- 6Reconnect the nodesEdit the PAIRS array to change the wiring.
Real-world uses
Common Use Cases
Got questions?
Frequently Asked Questions
The script measures each node with getBoundingClientRect and computes its center relative to the diagram container. The icons are laid out with normal flexbox, and the wires connect to wherever they actually render. Change the spacing, add nodes, or resize the window and the connectors follow the real positions.
Each animated path has a stroke-dasharray of one short bright segment (18% of the wire length from getTotalLength) plus a gap as long as the whole wire. Animating stroke-dashoffset from the full length to negative the dash length slides that single segment along the path, so it looks like a packet of light traveling from node to hub, with a colored drop-shadow for glow.
Each wire's beam is animated with the Web Animations API at infinite iterations and a delay of its index times 320ms. The staggered delays mean the pulses ripple into the hub in sequence instead of all firing together, which reads as live data converging rather than a robotic, synchronized blink.
Yes. Because every wire is derived from measured positions, a resize listener just calls build() again, which clears the SVG and recomputes all paths and beams for the new layout. There's no separate mobile diagram to maintain — it re-routes itself whenever the container changes size.
Render the nodes in JSX or a template and build the SVG paths in a layout effect that runs after mount and on resize, using refs to measure node centers. Drive the beams with element.animate on the path refs. Keep the PAIRS and color config as constants. In Tailwind, style the nodes and hub with utilities and keep the SVG wires in a component-managed effect since they require measurement.