Source Code
<div class="wrap">
<div class="card">
<div class="top">
<div class="left">
<div class="city">San Francisco</div>
<div class="country">California, US</div>
<div class="temp-row">
<span class="temp">18</span>
<span class="unit">°C</span>
</div>
<div class="condition">Partly Cloudy</div>
<div class="feels">Feels like 16°C</div>
</div>
<div class="right">
<svg class="weather-icon" viewBox="0 0 120 80" fill="none" xmlns="http://www.w3.org/2000/svg">
<circle cx="40" cy="38" r="20" fill="#fbbf24" opacity="0.9"/>
<ellipse cx="65" cy="52" rx="28" ry="18" fill="white" opacity="0.95"/>
<ellipse cx="48" cy="56" rx="22" ry="14" fill="white"/>
<ellipse cx="80" cy="58" rx="18" ry="12" fill="#e2e8f0"/>
</svg>
</div>
</div>
<div class="stats">
<div class="stat">
<svg width="16" height="16" viewBox="0 0 24 24" fill="none" stroke="currentColor" stroke-width="2"><path d="M12 2a10 10 0 1 0 0 20 10 10 0 0 0 0-20z"/><path d="M12 6v6l4 2"/></svg>
<div class="stat-label">Humidity</div>
<div class="stat-val">74%</div>
</div>
<div class="stat">
<svg width="16" height="16" viewBox="0 0 24 24" fill="none" stroke="currentColor" stroke-width="2"><path d="M9.59 4.59A2 2 0 1 1 11 8H2m10.59 11.41A2 2 0 1 0 14 16H2m15.73-8.27A2.5 2.5 0 1 1 19.5 12H2"/></svg>
<div class="stat-label">Wind</div>
<div class="stat-val">14 km/h</div>
</div>
<div class="stat">
<svg width="16" height="16" viewBox="0 0 24 24" fill="none" stroke="currentColor" stroke-width="2"><circle cx="12" cy="12" r="5"/><line x1="12" y1="1" x2="12" y2="3"/><line x1="12" y1="21" x2="12" y2="23"/><line x1="4.22" y1="4.22" x2="5.64" y2="5.64"/><line x1="18.36" y1="18.36" x2="19.78" y2="19.78"/><line x1="1" y1="12" x2="3" y2="12"/><line x1="21" y1="12" x2="23" y2="12"/><line x1="4.22" y1="19.78" x2="5.64" y2="18.36"/><line x1="18.36" y1="5.64" x2="19.78" y2="4.22"/></svg>
<div class="stat-label">UV Index</div>
<div class="stat-val">3 Low</div>
</div>
<div class="stat">
<svg width="16" height="16" viewBox="0 0 24 24" fill="none" stroke="currentColor" stroke-width="2"><path d="M14 14.76V3.5a2.5 2.5 0 0 0-5 0v11.26a4.5 4.5 0 1 0 5 0z"/></svg>
<div class="stat-label">Dew Point</div>
<div class="stat-val">13°C</div>
</div>
</div>
<div class="forecast">
<div class="fc-day">
<span class="fc-label">Mon</span>
<svg class="fc-icon" viewBox="0 0 40 28" fill="none"><circle cx="14" cy="13" r="7" fill="#fbbf24" opacity="0.9"/><ellipse cx="24" cy="18" rx="10" ry="7" fill="white"/></svg>
<span class="fc-hi">21°</span>
<span class="fc-lo">12°</span>
</div>
<div class="fc-day">
<span class="fc-label">Tue</span>
<svg class="fc-icon" viewBox="0 0 40 28" fill="none"><ellipse cx="20" cy="16" rx="14" ry="9" fill="#94a3b8"/><line x1="10" y1="22" x2="8" y2="28" stroke="#7dd3fc" stroke-width="2" stroke-linecap="round"/><line x1="16" y1="22" x2="14" y2="28" stroke="#7dd3fc" stroke-width="2" stroke-linecap="round"/><line x1="22" y1="22" x2="20" y2="28" stroke="#7dd3fc" stroke-width="2" stroke-linecap="round"/></svg>
<span class="fc-hi">15°</span>
<span class="fc-lo">9°</span>
</div>
<div class="fc-day">
<span class="fc-label">Wed</span>
<svg class="fc-icon" viewBox="0 0 40 28" fill="none"><ellipse cx="20" cy="16" rx="14" ry="9" fill="#64748b"/><line x1="10" y1="22" x2="8" y2="28" stroke="#7dd3fc" stroke-width="2" stroke-linecap="round"/><line x1="16" y1="22" x2="14" y2="28" stroke="#7dd3fc" stroke-width="2" stroke-linecap="round"/><line x1="22" y1="22" x2="20" y2="28" stroke="#7dd3fc" stroke-width="2" stroke-linecap="round"/><line x1="28" y1="22" x2="26" y2="28" stroke="#7dd3fc" stroke-width="2" stroke-linecap="round"/></svg>
<span class="fc-hi">13°</span>
<span class="fc-lo">8°</span>
</div>
<div class="fc-day">
<span class="fc-label">Thu</span>
<svg class="fc-icon" viewBox="0 0 40 28" fill="none"><circle cx="14" cy="13" r="7" fill="#fbbf24" opacity="0.7"/><ellipse cx="24" cy="18" rx="10" ry="7" fill="#e2e8f0"/></svg>
<span class="fc-hi">19°</span>
<span class="fc-lo">11°</span>
</div>
<div class="fc-day">
<span class="fc-label">Fri</span>
<svg class="fc-icon" viewBox="0 0 40 28" fill="none"><circle cx="20" cy="12" r="8" fill="#fbbf24" opacity="0.9"/></svg>
<span class="fc-hi">23°</span>
<span class="fc-lo">14°</span>
</div>
</div>
<div class="updated">Updated just now · Open-Meteo API</div>
</div>
</div>* { box-sizing: border-box; margin: 0; padding: 0; }
body { font-family: system-ui, sans-serif; background: linear-gradient(135deg, #0369a1 0%, #0ea5e9 50%, #38bdf8 100%); min-height: 100vh; display: flex; align-items: center; justify-content: center; padding: 20px; }
.wrap { width: 100%; max-width: 380px; }
.card { background: rgba(255,255,255,0.12); backdrop-filter: blur(20px); -webkit-backdrop-filter: blur(20px); border: 1px solid rgba(255,255,255,0.25); border-radius: 24px; padding: 24px; color: #fff; }
.top { display: flex; justify-content: space-between; align-items: flex-start; margin-bottom: 24px; }
.left { flex: 1; }
.city { font-size: 20px; font-weight: 800; }
.country { font-size: 12px; color: rgba(255,255,255,0.7); margin-bottom: 12px; }
.temp-row { display: flex; align-items: flex-start; line-height: 1; margin-bottom: 4px; }
.temp { font-size: 56px; font-weight: 900; line-height: 1; }
.unit { font-size: 24px; font-weight: 300; margin-top: 8px; color: rgba(255,255,255,0.8); }
.condition { font-size: 15px; font-weight: 600; color: rgba(255,255,255,0.9); margin-bottom: 2px; }
.feels { font-size: 12px; color: rgba(255,255,255,0.6); }
.right { flex-shrink: 0; }
.weather-icon { width: 110px; height: 74px; }
.stats { display: grid; grid-template-columns: 1fr 1fr; gap: 12px; margin-bottom: 24px; }
.stat { background: rgba(255,255,255,0.1); border-radius: 14px; padding: 12px 14px; }
.stat svg { color: rgba(255,255,255,0.7); margin-bottom: 6px; }
.stat-label { font-size: 11px; color: rgba(255,255,255,0.6); margin-bottom: 2px; }
.stat-val { font-size: 15px; font-weight: 700; }
.forecast { display: flex; gap: 8px; justify-content: space-between; margin-bottom: 16px; }
.fc-day { flex: 1; display: flex; flex-direction: column; align-items: center; gap: 4px; background: rgba(255,255,255,0.08); border-radius: 12px; padding: 10px 4px; }
.fc-label { font-size: 11px; color: rgba(255,255,255,0.6); font-weight: 600; }
.fc-icon { width: 36px; height: 26px; }
.fc-hi { font-size: 13px; font-weight: 700; }
.fc-lo { font-size: 11px; color: rgba(255,255,255,0.5); }
.updated { font-size: 10px; color: rgba(255,255,255,0.4); text-align: right; }Learn Coding Visually
Learn to code with interactive, live-preview playgrounds — HTML, CSS, JavaScript, React & more.
 HTML Playground42 lessons · Click-based · Live preview
 CSS PlaygroundLearn CSS with a live editor
 JavaScript Playground60 lessons · DOM · Async · Canvas
 React PlaygroundLearn React with a live code editor
 GSAP PlaygroundLearn GSAP animation interactively
 SVG Playground44 lessons · shapes · paths · animation
 SCSS Playground45 lessons · Sass modules · tokens
 Tailwind PlaygroundLearn Tailwind CSS with a live editor
 Bootstrap 5 Playground50 lessons · live preview
Weather Widget Card — Free HTML CSS Snippet
Weather Widget · Cards · Plain HTML & CSS · Live preview
What's included
Features
About this UI Snippet
Weather Widget — Glassmorphism Card with Forecast Strip and Detail Stats
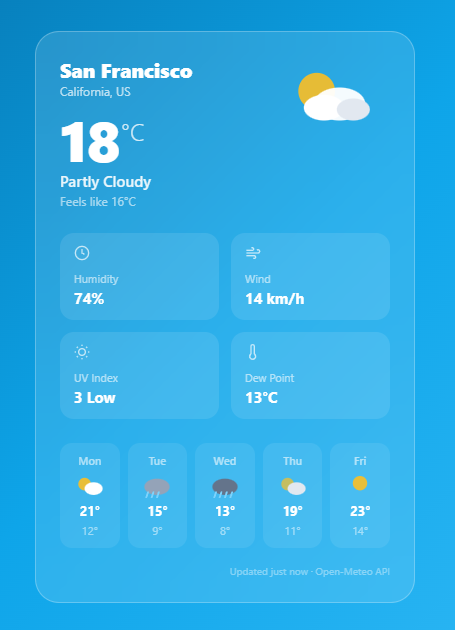
A weather widget is one of the most commonly requested UI cards for dashboards, landing pages, travel apps, and home screens. This snippet delivers a complete glassmorphism weather card with a large temperature display, partly-cloudy inline SVG weather icon, humidity/wind/UV/dew-point stat grid, a 5-day mini forecast strip with per-day SVG icons, and an "Updated just now" attribution footer.
The glassmorphism effect
The card uses the same glassmorphism recipe — background: rgba(255,255,255,0.12) with backdrop-filter: blur(20px) over a gradient background. backdrop-filter blurs whatever is behind the element, creating the frosted glass look. A semi-transparent white border (rgba(255,255,255,0.25)) adds a subtle edge highlight. This effect requires the body or a parent to have a visible background — in this case a blue gradient simulating a clear sky.
Inline SVG weather icons
All weather icons in the snippet are hand-crafted inline SVGs using primitive shapes — circles for the sun, ellipses for clouds, and short lines for rain drops. This avoids any icon library dependency. The forecast strip uses five different SVG variations: sunny, partly cloudy, light rain, heavy rain, and cloudy — built from the same circle/ellipse/line primitives.
The stat grid
Four weather detail stats (Humidity, Wind, UV Index, Dew Point) use a 2-column CSS Grid inside the card. Each .stat block has a lightly tinted glass background, a label, and a value. The SVG icons inside each block use currentColor — they inherit the white text color automatically.
Production API integration
The snippet uses static data for the demo. To wire it to live data, use the Open-Meteo API (free, no key required): fetch the /forecast endpoint with latitude, longitude, and current_weather=true parameters. The API returns temperature, windspeed, and a weathercode integer you can map to condition strings and SVG icons.
Geolocation for automatic local weather
To show the user's own local weather automatically, call navigator.geolocation.getCurrentPosition(pos => { const { latitude, longitude } = pos.coords; fetchWeather(latitude, longitude); }). On success, use the coordinates to call the Open-Meteo or OpenWeatherMap API. For a city name label, reverse geocode the coordinates using the Open-Meteo geocoding API or BigDataCloud's free reverse geocoding endpoint — both return a city name and country without an API key.
Celsius and Fahrenheit toggle
Store the raw Celsius value in a variable. A unit toggle button calls a convertTemp() function that either displays the raw value (°C) or applies Math.round(temp * 9/5 + 32) for °F. Toggle a data-unit attribute on the card container and update both the .temp element and all forecast high/low values in a single pass. The feels-like temperature uses the same formula. Store the unit preference in localStorage so the user's choice persists across page loads.
Build with AI
Build, Understand, Optimize, and Extend It With AI
Ask an AI coding assistant like Claude to break down exactly how the glassmorphism effect is built from just three CSS properties working together — the translucent rgba background, the backdrop-filter blur, and the semi-transparent border — and why all three need a colorful background behind the card (not a plain white page) to actually read as frosted glass. It's worth asking about the inline SVG icons too: since they're built entirely from circles, ellipses, and short lines, ask how you'd construct a couple of additional condition icons (like a thunderstorm or fog) following the exact same primitive-shape approach already used for sunny and rainy. For extending it, ask for a live fetch against the Open-Meteo API with a full WMO weather-code-to-icon mapping table, a Celsius/Fahrenheit toggle with the preference persisted in localStorage, or a geolocation-based auto-detect of the user's own city. Treat the code less like a finished artifact and more like a starting point for a conversation.
Prompt to recreate it
Copy this into your AI assistant of choice to build the effect from scratch, or as a jumping-off point for your own variant:
Build a glassmorphism weather widget card in plain HTML and CSS, with hand-drawn inline SVG weather icons — no icon library, no images, no JavaScript required for the static version.

Requirements:
- A card with a translucent white background (using an rgba fill, not a solid color), a backdrop-filter blur applied to that background, and a subtle semi-transparent white border, sitting over a colorful gradient page background so the frosted-glass effect is actually visible.
- A prominent header showing the city and country, a large temperature number with a smaller degree-unit label, a condition label, and a "feels like" temperature, alongside a hand-built inline SVG icon representing the current condition using only basic shape primitives — circles for a sun, ellipses for clouds, no bitmap images.
- A four-item stat grid (such as humidity, wind, UV index, and dew point) laid out with CSS Grid at two columns, where each stat block has its own subtly tinted glass background, a label, a value, and a small SVG icon that uses currentColor so it automatically inherits the surrounding text color.
- A five-day forecast strip where each day is an equal-width tile containing a day label, a distinct inline SVG icon representing that day's condition (at least three visually different icon variants across the five days — sunny, cloudy, rainy), and a high and low temperature.
- Build every weather icon (current and forecast) from the same limited set of SVG primitives — circles, ellipses, and lines — reused with different fills, opacities, and arrangements to represent different conditions, rather than pulling in separate icon assets per condition.
- Include a comment or structure that makes it clear how the static demo data (city, temperatures, stats, forecast) would be replaced by a live weather API response without changing the markup structure.
Want to tighten it up first? Run this prompt through the AI Prompt Studio to score it across 8 quality dimensions, catch anti-patterns, and tune the wording for Claude, ChatGPT, or Gemini before you paste it in.
Step by step
How to Use
- 1Update the location and dataEdit the .city and .country text. Change the .temp number, .condition text, .feels text, and the four .stat-val values to match your target location.
- 2Update the 5-day forecastEdit each .fc-day block: change .fc-label (day name), .fc-hi and .fc-lo (high/low temps), and replace the .fc-icon SVG with the appropriate weather condition SVG.
- 3Fetch live data from Open-MeteoOpen-Meteo is free, no API key required. Call: fetch("https://api.open-meteo.com/v1/forecast?latitude=37.77&longitude=-122.42¤t_weather=true&daily=temperature_2m_max,temperature_2m_min,weathercode&timezone=auto"). Map the returned weathercode to condition labels and choose the matching SVG.
- 4Add a location searchAdd a search box and use the Open-Meteo geocoding API to convert city names to coordinates. On submit, call the forecast API with the returned latitude and longitude and update the card DOM.
- 5Export for your frameworkClick "JSX" for a React component that accepts a weather data prop object. Click "Vue" for a Vue 3 SFC. Click "Tailwind" for a React + Tailwind version.
Real-world uses
Common Use Cases
Got questions?
Frequently Asked Questions
Use Open-Meteo (free, no API key): fetch(https://api.open-meteo.com/v1/forecast?latitude=${lat}&longitude=${lon}¤t_weather=true&daily=temperature_2m_max,temperature_2m_min,weathercode&timezone=auto). The response includes current_weather.temperature, current_weather.weathercode, and daily arrays for the 7-day forecast. Map weathercode integers to condition labels and icon variants.
backdrop-filter is supported in Chrome, Edge, Safari, and Firefox 103+. For older Firefox, add -webkit-backdrop-filter as a fallback (already included in the snippet). For browsers with no support, the card still renders correctly — just without the blur behind it (the rgba background still shows).
Open-Meteo uses WMO Weather Code definitions. Map the code ranges: 0=Clear, 1-3=Partly cloudy, 45-48=Foggy, 51-67=Rain, 71-77=Snow, 80-82=Showers, 95-99=Thunderstorm. Build a lookup object: const WMO = { 0: { label: "Clear", icon: "sunny" }, ... } and index it with weathercode. For codes that fall in ranges, use a helper: function getCondition(code) { if (code === 0) return WMO[0]; if (code <= 3) return WMO[1]; if (code <= 48) return WMO[45]; ... }. Map each condition key to one of your inline SVG variants (sunny, partlyCloudy, rainy, snowy, stormy). Store SVG strings in a conditionIcons object and set innerHTML of .weather-icon using the matched icon key. This gives fully dynamic icon rendering driven by the live API weathercode value.
Accept a weather prop object: { city, country, temp, condition, feels, humidity, wind, uv, dewpoint, forecast[] }. Render the card from props. Fetch data in useEffect on mount: useEffect(() => { fetchWeather(lat, lon).then(setWeather); }, [lat, lon]). Show a skeleton loader while data is loading by rendering grey placeholder divs with an animated shimmer in the card before the weather prop is populated. Handle the error state by showing a "Could not load weather" message with a Retry button that re-triggers the fetch. For multi-location support, store an array of location objects in state and render a WeatherCard for each, passing its own lat/lon as props.