Learn Coding Visually
Learn to code with interactive, live-preview playgrounds — HTML, CSS, JavaScript, React & more.
 HTML Playground42 lessons · Click-based · Live preview
 CSS PlaygroundLearn CSS with a live editor
 JavaScript Playground60 lessons · DOM · Async · Canvas
 React PlaygroundLearn React with a live code editor
 GSAP PlaygroundLearn GSAP animation interactively
 SVG Playground44 lessons · shapes · paths · animation
 SCSS Playground45 lessons · Sass modules · tokens
 Tailwind PlaygroundLearn Tailwind CSS with a live editor
 Bootstrap 5 Playground50 lessons · live preview
ECharts Treemap Storage Breakdown — Free Drill-Down Snippet
ECharts Treemap Storage Breakdown · Charts · Plain HTML, CSS & JS · Live preview
What's included
Features
About this UI Snippet
ECharts Treemap Storage Breakdown — Area Encodes Size, Clicking Drills In
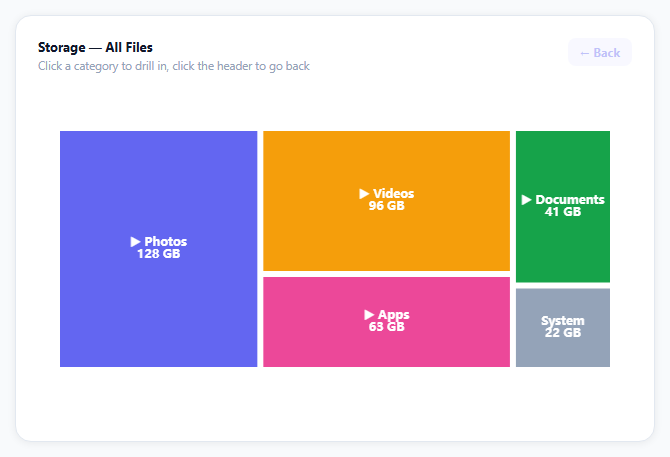
A pie chart runs out of room past five or six slices. A bar chart can't show a category's internal breakdown without a second chart. A treemap solves both: every box's *area* is proportional to its value, nested categories render as boxes inside boxes, and clicking one zooms the whole chart into just that subtree — which is exactly how a storage-usage screen should work.
leafDepth is what keeps the first view at the top level
Without it, ECharts renders every leaf of a nested dataset at once — Camera Roll, Screenshots, Recordings, PDFs, and every other grandchild flattened into one crowded grid, with no visible "Photos" or "Videos" box to click. Setting leafDepth: 1 on the series tells ECharts to treat whatever is one level below the *current root* as the leaves to render, so the initial view shows exactly the five top-level categories, and after zooming into "Photos" it shows exactly that category's three children — the same option re-applies relative to the new root automatically.
nodeClick: 'zoomToNode' is the click interaction itself
That option is what turns "Photos" into a clickable box that replaces the entire chart with its children filling the same space — no manual state management, no re-rendering a different dataset. ECharts tracks the "current root" of the treemap internally and re-lays-out from there, and leafDepth re-evaluates against whatever that new root is.
Getting back out: dispatchAction, not setOption
Reversing the zoom isn't done by calling setOption again — that would just re-render the same drilled-in view. Instead, chart.dispatchAction({ type: 'treemapRootToNode', targetNode: '' }) is the documented action for resetting a treemap's root back to the top level, which is what the Back button calls.
A click handler updates the surrounding UI
The chart's own click event fires on every box click, and the handler checks whether the clicked node has children before updating the header title and enabling the Back button — clicking a leaf node (like "PDFs", which has no further breakdown) still triggers ECharts' own click event but shouldn't change the surrounding chrome, since there's nowhere further to drill.
Two label layers, one hidden
label styles the text inside whichever boxes are currently the smallest visible unit; upperLabel would style a *parent* box's label when its children are also visible (common in flattened multi-level treemaps) — turned off here (show: false) because nodeClick: 'zoomToNode' never shows two levels at once, so an upper label would never actually render and is disabled for clarity.
Reusing it
Swap the storage categories for any hierarchical size data — folder sizes, budget line items, org headcount by department — and the drill-down interaction, back button, and tooltip keep working unchanged since they only depend on the children structure being present or absent.
Build with AI
Build, Understand, Optimize, and Extend It With AI
You don't have to build drill-down state management by hand. Paste this snippet's HTML, CSS, and JS into an AI coding assistant like Claude and ask it to explain exactly how nodeClick: 'zoomToNode' handles the zoom-in interaction internally versus how dispatchAction with treemapRootToNode resets it, and why setOption alone cannot undo a treemap's current zoom state. The same assistant can help optimize it — ask whether the click handler's check for p.data.children is the most robust way to distinguish drillable nodes from leaves, and whether the two-level levels array styling is necessary given the current data only nests one level deep. It's also useful for extending the effect: ask it to add a breadcrumb trail showing the full drill-down path instead of a single Back button, support for a third nesting level, or a search box that highlights matching boxes across all levels. Treat the code less like a finished artifact and more like a starting point for a conversation.
Prompt to recreate it
Copy this into your AI assistant of choice to build the effect from scratch, or as a jumping-off point for your own variant:
Build a clickable, drill-down treemap visualization (such as a device storage breakdown) using Apache ECharts (load echarts from a CDN, no other library), in plain HTML, CSS, and JavaScript.

Requirements:
- Model the data as a hierarchical list: top-level categories each with a name and a numeric value, where some categories additionally have a nested list of subcategory objects of the same shape (name and value).
- Render it as a treemap where each box's area is proportional to its value, colored by top-level category, with the category name and its value (with a unit label such as "GB") shown as text inside each box.
- Configure the treemap so that clicking a box which has subcategories zooms the entire chart into showing just that box's children filling the available space, using the library's built-in drill-down behavior rather than manually swapping out the chart's data.
- Show a header above the chart that displays which level is currently in view (e.g. "All Files" at the top level, or the clicked category's name after drilling in), and a Back button that is disabled at the top level and enabled after drilling into a category.
- Make the Back button reset the treemap to its top-level view using the library's dedicated action for resetting a treemap's zoom/root state (not by re-calling the option-setting method with the original data, which would not undo an internal zoom state).
- Ensure that clicking a box with no subcategories does not incorrectly enable the Back button or change the header, since there is nothing further to drill into.
- Show a tooltip on hover with the box's name and its exact value.
- Keep the chart instance responsive to its container being resized by calling the chart's resize method whenever the container's size changes.
Want to tighten it up first? Run this prompt through the AI Prompt Studio to score it across 8 quality dimensions, catch anti-patterns, and tune the wording for Claude, ChatGPT, or Gemini before you paste it in.
Source Code
<div class="etm-wrap">
<div class="etm-card">
<div class="etm-head">
<div>
<div class="etm-title" id="etmTitle">Storage — All Files</div>
<div class="etm-sub">Click a category to drill in, click the header to go back</div>
</div>
<button class="etm-back" id="etmBack" type="button" disabled>← Back</button>
</div>
<div class="etm-chart" id="etmChart"></div>
</div>
</div>*{box-sizing:border-box;margin:0;padding:0}
body{font-family:system-ui,-apple-system,sans-serif;background:#f8fafc;min-height:100vh;display:flex;align-items:center;justify-content:center;padding:24px}
.etm-wrap{width:100%;max-width:640px}
.etm-card{background:#fff;border-radius:16px;padding:22px;box-shadow:0 1px 8px rgba(0,0,0,.07);border:1px solid #e2e8f0}
.etm-head{display:flex;justify-content:space-between;align-items:flex-start;gap:12px;margin-bottom:6px}
.etm-title{font-size:13px;font-weight:700;color:#0f172a}
.etm-sub{font-size:11.5px;color:#94a3b8;margin-top:3px}
.etm-back{background:#eef0ff;color:#6366f1;border:none;border-radius:8px;padding:6px 12px;font:700 12px system-ui,sans-serif;cursor:pointer;white-space:nowrap}
.etm-back:disabled{opacity:.4;cursor:default}
.etm-back:not(:disabled):hover{background:#e0e4ff}
.etm-chart{width:100%;height:340px}var el = document.getElementById('etmChart');
var titleEl = document.getElementById('etmTitle');
var backBtn = document.getElementById('etmBack');
var chart = echarts.init(el);
// Each top-level node carries its own explicit itemStyle.color rather than
// relying on the treemap's implicit level-0 color list -- that list is
// assigned by post-sort index (treemap sorts by value descending by
// default), so an explicit color per node is what guarantees "Photos" is
// always indigo regardless of how the values happen to rank.
var data = [
{ name: 'Photos', value: 128, itemStyle: { color: '#6366f1' }, children: [
{ name: 'Camera Roll', value: 74 },
{ name: 'Screenshots', value: 31 },
{ name: 'Edited', value: 23 },
]},
{ name: 'Videos', value: 96, itemStyle: { color: '#f59e0b' }, children: [
{ name: 'Recordings', value: 58 },
{ name: 'Downloaded', value: 38 },
]},
{ name: 'Documents', value: 41, itemStyle: { color: '#16a34a' }, children: [
{ name: 'PDFs', value: 22 },
{ name: 'Spreadsheets', value: 12 },
{ name: 'Other', value: 7 },
]},
{ name: 'Apps', value: 63, itemStyle: { color: '#ec4899' }, children: [
{ name: 'Games', value: 40 },
{ name: 'Tools', value: 23 },
]},
{ name: 'System', value: 22, itemStyle: { color: '#94a3b8' } },
];
var option = {
tooltip: {
backgroundColor: '#0f172a',
borderWidth: 0,
textStyle: { color: '#fff', fontSize: 12 },
formatter: function (p) { return '<b>' + p.name + '</b><br/>' + p.value + ' GB'; },
},
series: [{
type: 'treemap',
roam: false,
nodeClick: 'zoomToNode',
leafDepth: 1,
breadcrumb: { show: false },
label: {
show: true,
formatter: function (p) { return p.name + '\n' + p.value + ' GB'; },
color: '#fff',
fontWeight: 700,
fontSize: 12,
},
upperLabel: { show: false },
itemStyle: { borderColor: '#fff', borderWidth: 2, gapWidth: 2 },
levels: [
{ itemStyle: { borderWidth: 0 } },
{ itemStyle: { borderColor: 'rgba(255,255,255,.6)' } },
],
data: data,
}],
};
chart.setOption(option);
chart.on('click', function (p) {
if (p.data && p.data.children && p.data.children.length) {
titleEl.textContent = 'Storage — ' + p.name;
backBtn.disabled = false;
}
});
backBtn.addEventListener('click', function () {
chart.dispatchAction({ type: 'treemapRootToNode', targetNode: '' });
titleEl.textContent = 'Storage — All Files';
backBtn.disabled = true;
});
var ro = new ResizeObserver(function () { chart.resize(); });
ro.observe(el);Step by step
How to Use
- 1Add the ECharts CDNLoad echarts.min.js before the snippet's JS runs.
- 2Paste HTML, CSS, and JSFive top-level storage categories render as sized boxes.
- 3Click a box with childrenThe chart zooms into its subcategories.
- 4Read the updated headerIt names the category you drilled into.
- 5Click BackThe treemap resets to the top-level view.
- 6Hover any boxThe tooltip shows its exact size in GB.
Real-world uses
Common Use Cases
Got questions?
Frequently Asked Questions
The series sets leafDepth: 1, which tells ECharts to render only the nodes one level below the current root as visible boxes — at the top level that means the 5 top-level categories, not their combined 11 grandchildren all flattened together. Without leafDepth, a treemap given multi-level data renders every leaf in the whole tree at once, which would show Camera Roll, Screenshots, Recordings and every other grandchild crowded into one view with no top-level category to click.
The series option nodeClick: 'zoomToNode' tells ECharts to handle box clicks itself: when a node with children is clicked, the chart replaces its current view with that node's children filling the same space, tracking the new "root" internally, and leafDepth: 1 re-evaluates against that new root so exactly one level is shown again. No manual re-rendering or data-swapping code is needed on your end for the zoom itself.
Calling setOption again would just redraw the same option object, including whatever root the treemap is currently zoomed to — it does not reset the zoom state. dispatchAction({ type: 'treemapRootToNode', targetNode: '' }) is the specific documented action for resetting a treemap's internal root back to the top level, which setOption has no equivalent for.
The chart's own click event handler receives the clicked node's full data object, including its children array if one was defined in the original data. Checking p.data.children && p.data.children.length lets the handler distinguish a drillable category (update the header, enable Back) from a leaf node like a specific file type that has nothing further to show.
Replace the data array with your own nodes, each an object with a name, a value, and optionally a children array of the same shape for any node with subcategories. Leaf nodes (no children) render as plain boxes; nodes with children become clickable drill-down targets automatically once nodeClick: 'zoomToNode' is set.
Initialize the chart once against a container ref/template ref, attach the click listener via chart.on('click', ...) in the same effect/lifecycle hook, and keep the current root name in component state to drive your header and button rather than reading it back from the chart. Dispose the instance on unmount and keep the ResizeObserver pattern for responsive sizing.