Source Code
<section class="bch-stage" id="bchStage">
  <div class="bch-intro-overlay"><p>Scroll ↓ to grow the chart</p></div>
  <div class="bch-wrap"><div class="bch-canvas" id="bchMount"></div></div>
  <div class="bch-hud"><span id="bchPct">0</span>% grown</div>
</section>
<section class="bch-bottom"><p>The chart is complete — scroll up to reset it.</p></section>*{box-sizing:border-box;margin:0;padding:0}
html,body{background:#0a0a12;color:#fff;font-family:system-ui,-apple-system,sans-serif}
.bch-bottom{min-height:70vh;display:flex;justify-content:center;align-items:center;color:#7c83a6;font-size:15px;letter-spacing:.08em;text-transform:uppercase}
.bch-stage{height:100vh;position:relative;overflow:hidden;background:radial-gradient(circle at 50% 42%,#14152a 0%,#0a0a12 60%)}
.bch-intro-overlay{position:absolute;inset:0;display:flex;align-items:center;justify-content:center;text-align:center;padding:24px;pointer-events:none;z-index:5;color:#8a90c0;font-size:15px;letter-spacing:.08em;text-transform:uppercase;transition:opacity .4s ease}
.bch-wrap{position:absolute;inset:0;display:flex;align-items:center;justify-content:center}
.bch-canvas{width:min(88vw,480px);height:320px}
.bch-canvas svg{display:block;filter:drop-shadow(0 8px 24px rgba(116,132,250,.28))}
.bch-hud{position:absolute;left:24px;bottom:24px;font-variant-numeric:tabular-nums;font-size:13px;letter-spacing:.14em;color:#a5b4fc;text-transform:uppercase;opacity:.85}const mount = document.getElementById('bchMount');
const pctEl = document.getElementById('bchPct');
const intro = document.querySelector('.bch-intro-overlay');
// Build Lottie JSON in code. Every animated keyframe gets its i/o easing
// tangents — without them lottie-web holds the value and the bar never grows.
const S = (v) => ({ a: 0, k: v });
function kfM(pairs, dim) {
const t = Array(dim).fill(0.5);
return { a: 1, k: pairs.map((p, i) => i < pairs.length - 1
? { i: { x: t.slice(), y: t.slice() }, o: { x: t.slice(), y: t.slice() }, t: p[0], s: p[1] }
: { t: p[0], s: p[1] }) };
}
function layer(ind, nm, shapes) {
return { ddd: 0, ind, ty: 4, nm, sr: 1,
ks: { o: S(100), r: S(0), p: S([0, 0, 0]), a: S([0, 0, 0]), s: S([100, 100, 100]) },
ao: 0, shapes, ip: 0, op: 120, st: 0, bm: 0 };
}
const lerp = (a, b, t) => a + (b - a) * t;
function hue(t) { return [lerp(0.4, 0.72, t), lerp(0.5, 0.42, t), lerp(0.98, 0.95, t), 1]; }
const W = 480, H = 320, BASE = 262, MAXH = 190, BW = 34, N = 7;
const HEIGHTS = [0.46, 0.72, 0.4, 0.96, 0.6, 0.82, 0.54];
const X0 = 56, GAP = (W - 2 * X0) / (N - 1);
const bars = [];
for (let k = 0; k < N; k++) {
const bh = HEIGHTS[k] * MAXH;
bars.push(layer(k + 2, 'bar' + k, [{ ty: 'gr', it: [
// rect sits ABOVE the group origin so scaling y grows it up from the base
{ ty: 'rc', d: 1, s: S([BW, bh]), p: S([0, -bh / 2]), r: S(7) },
{ ty: 'fl', c: S(hue(k / (N - 1))), o: S(100) },
{ ty: 'tr', p: S([X0 + GAP * k, BASE]), a: S([0, 0]),
// staggered scale: y goes 0 -> 100, growing the bar from its base
s: kfM([[k * 9, [100, 0]], [k * 9 + 42, [100, 100]]], 2), r: S(0), o: S(100) },
] }]));
}
const baseline = layer(1, 'baseline', [{ ty: 'gr', it: [
{ ty: 'rc', d: 1, s: S([W - 2 * X0 + BW, 3]), p: S([W / 2, BASE + 2]), r: S(2) },
{ ty: 'fl', c: S([1, 1, 1, 1]), o: S(14) },
{ ty: 'tr', p: S([0, 0]), a: S([0, 0]), s: S([100, 100]), r: S(0), o: S(100) },
] }]);
const animationData = {
v: '5.7.4', fr: 60, ip: 0, op: 120, w: W, h: H, nm: 'bar-chart', ddd: 0, assets: [],
layers: [baseline, ...bars],
};
// Load but DON'T autoplay — scroll drives the growth.
const anim = lottie.loadAnimation({
container: mount, renderer: 'svg', loop: false, autoplay: false, animationData,
});
let total = 0;
anim.addEventListener('DOMLoaded', () => { total = anim.totalFrames; });
gsap.registerPlugin(ScrollTrigger);
const state = { p: 0 };
gsap.to(state, {
p: 1, ease: 'none',
scrollTrigger: { trigger: '#bchStage', start: 'top top', end: '+=400%', scrub: 0.5, pin: true },
});
function tick() {
requestAnimationFrame(tick);
if (!total) return;
const p = Math.max(0, Math.min(1, state.p));
anim.goToAndStop(p * (total - 1), true);
pctEl.textContent = Math.round(p * 100);
if (intro) intro.style.opacity = p > 0.02 ? '0' : '1';
}
tick();Learn Coding Visually
Learn to code with interactive, live-preview playgrounds — HTML, CSS, JavaScript, React & more.
 HTML Playground42 lessons · Click-based · Live preview
 CSS PlaygroundLearn CSS with a live editor
 JavaScript Playground60 lessons · DOM · Async · Canvas
 React PlaygroundLearn React with a live code editor
 GSAP PlaygroundLearn GSAP animation interactively
 SVG Playground44 lessons · shapes · paths · animation
 SCSS Playground45 lessons · Sass modules · tokens
 Tailwind PlaygroundLearn Tailwind CSS with a live editor
 Bootstrap 5 Playground50 lessons · live preview
Lottie Scroll Bar Chart — Bars Grow on Scroll
Lottie Scroll Bar Chart · Scroll · Plain HTML, CSS & JS · Live preview
What's included
Features
About this UI Snippet
How to Build a Scroll-Driven Lottie Bar Chart That Grows Column by Column
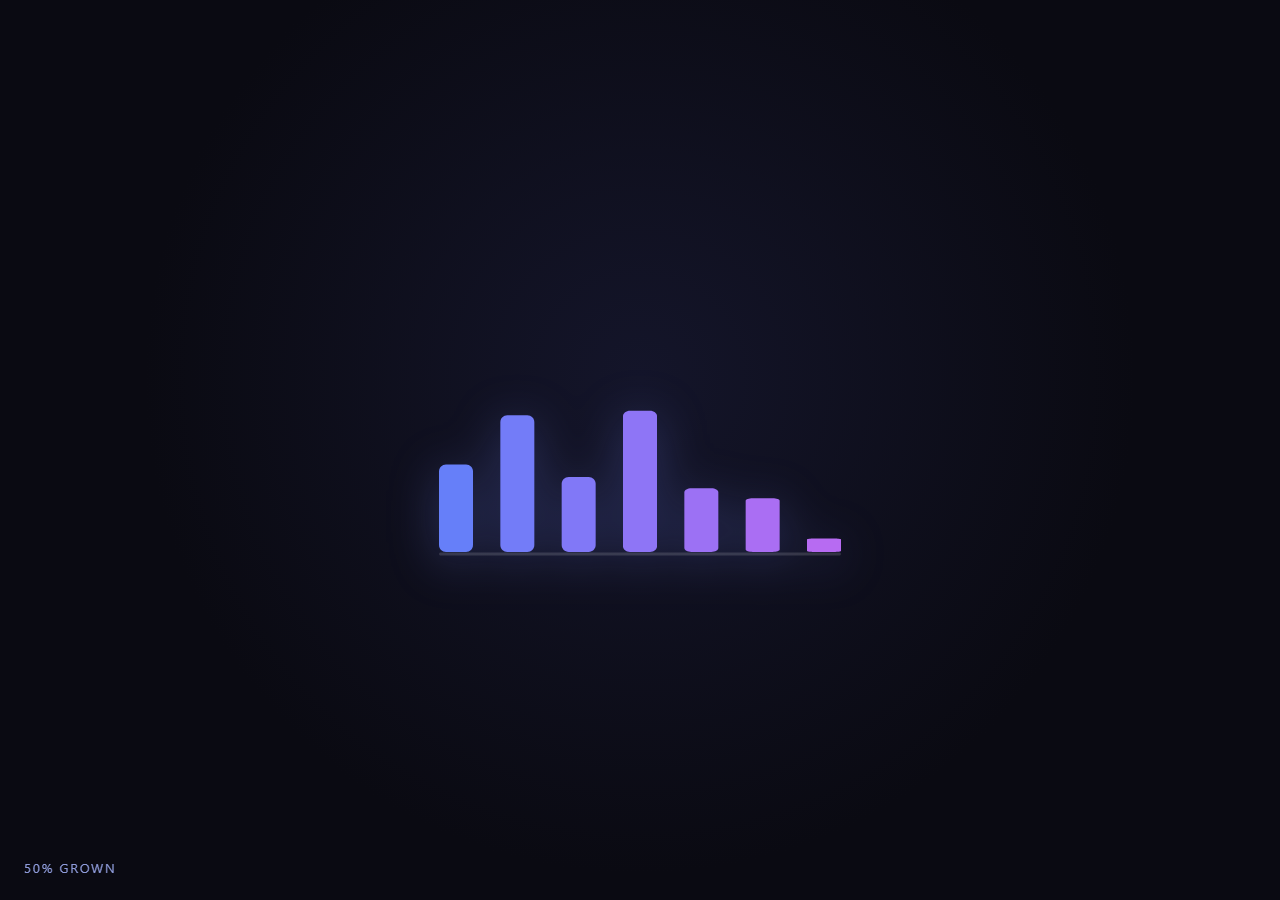
The Lottie Scroll Bar Chart snippet grows a row of coloured bars up from a baseline as the visitor scrolls, one column staggered a beat behind the next, and shrinks them back down on the way up. Nothing plays on a timer — the scrollbar drives the animation frame by frame — and the whole chart is generated in JavaScript rather than exported from After Effects, so the growth mechanism is fully visible in the code.
Lottie is JSON, and here it is assembled in code
A Lottie animation is a JSON document of vector layers and keyframes. Instead of fetching one, this snippet builds the animationData object directly and passes it to lottie.loadAnimation, so there is nothing to host and nothing that can 404. A small layer helper stamps out each bar, and a keyframe helper assembles the growth animation with the easing tangents lottie-web requires.
Growing a bar with scale, not height
The natural instinct is to animate a rectangle's height, but that grows it from the centre in both directions. The trick used here is to grow the bar with a transform scale instead. Each bar is a group whose origin sits exactly on the baseline; inside it, the rectangle is positioned so its whole body is above that origin. Animating only the group's vertical scale from 0 to 100 then stretches the bar upward from the base, exactly like a real column filling in — no repositioning maths required. At scale 0 the bar collapses onto the baseline and is invisible; at 100 it stands at full height.
The one keyframe detail that matters
When you author a Lottie by hand, every animated keyframe must carry its i (in) and o (out) bezier tangents. Omit them and lottie-web treats the keyframe as a hold keyframe: it never interpolates, so a scale animated 0 to 100 stays stuck at 0 and the bar never grows. The keyframe helper here attaches linear tangents to every keyframe, which is what makes the bars actually rise.
The column stagger
The bars do not all grow at once. Each bar's scale animation is offset by its column index — column two starts a beat after column one, and so on — so the chart fills in as a left-to-right sweep rather than a flat simultaneous pop. That single per-column delay is what gives the reveal its rhythm; without it the chart would feel like a snap rather than a build.
Autoplay off, scroll on
The animation is loaded with autoplay: false so its internal clock never runs. A GSAP ScrollTrigger pins the stage and scrubs a single plain value from 0 to 1 over a range several viewport-heights tall, and a requestAnimationFrame loop reads that value every frame and calls anim.goToAndStop(p * (totalFrames - 1), true). The true tells lottie-web the value is a frame number, and goToAndStop renders a single still frame without starting playback, so the chart's growth is welded to scroll position. Because lottie-web interpolates between keyframes, fractional frames render smoothly.
Reversible for free
Deriving the frame from one scrubbed value means scrolling up produces smaller values, so the bars shrink back down in reverse order with no extra code. A smoothed scrub: 0.5 lets the growth glide toward the scroll position rather than snapping to every wheel tick, and the caption fades out the instant the chart begins to build. Pair it with the Lottie scroll line draw for a trend line, or the Lottie scroll scrub ring for a summary stat.
Build with AI
Build, Understand, Optimize, and Extend It With AI
You do not have to reverse-engineer how a JSON file becomes a scroll-grown chart. Paste this snippet's HTML, CSS, and JS into an AI assistant like Claude and ask it to walk through why the bars grow with a scale transform instead of an animated height, or why every keyframe needs i/o tangents. The same assistant can help you extend it — ask it to add value labels above each bar, animate a horizontal grid line, feed the HEIGHTS array from real data, or turn the bars into a grouped or stacked chart. Treat the code as a conversation starter, not a finished artifact.
Prompt to recreate it
Copy this into your AI assistant of choice to build the effect from scratch, or as a jumping-off point for your own variant:
Build a "scroll-driven Lottie bar chart" in plain HTML, CSS, and JavaScript using lottie-web and GSAP's ScrollTrigger plugin, both from a CDN (no bundler).

Requirements:
- A pinned full-height section with a centered container div for the Lottie, an intro caption overlay, and a live "percent grown" read-out.
- Build the Lottie as an inline animationData JSON object (leave a comment showing how to swap it for path: 'your-animation.json'). Include a keyframe helper that ALWAYS attaches i/o easing tangents (linear) — without them lottie-web holds the value and nothing animates.
- The animation is a row of coloured bars that grow up from a baseline. Grow each bar with a transform scale, not by animating height: place the bar's rectangle above a base-aligned group origin and animate the group's vertical scale from 0 to 100. Colours interpolate across the bars by index.
- Stagger each bar's growth by its column index so the chart fills in left to right rather than all at once.
- Load with lottie.loadAnimation using renderer 'svg', loop false, autoplay FALSE.
- Register a GSAP tween on a ScrollTrigger targeting the pinned section, with pin true, start at top top, scrub around 0.5, and an end several hundred percent tall, animating one value p from 0 to 1.
- In a requestAnimationFrame loop, read p and call anim.goToAndStop(p * (anim.totalFrames - 1), true), update the read-out, and fade the caption out once p passes a small threshold.
- Confirm scrolling up shrinks the bars back down.
Want to tighten it up first? Run this prompt through the AI Prompt Studio to score it across 8 quality dimensions, catch anti-patterns, and tune the wording for Claude, ChatGPT, or Gemini before you paste it in.
Step by step
How to Use
- 1Load the three CDN scriptsAdd lottie.min.js, gsap.min.js, and ScrollTrigger.min.js from the CDN panel, in that order.
- 2Paste the HTML, CSS, and JSA baseline and a "% grown" read-out appear centred in a pinned stage, with the bars starting at zero height.
- 3Scroll downThe bars grow up from the baseline, column by column in a left-to-right stagger, tied directly to scroll position.
- 4Scroll back upThe bars shrink back down exactly, because goToAndStop seeks a single frame rather than playing on a timer.
- 5Set your own dataEdit the HEIGHTS array (values 0 to 1) and the bar count to plot your own figures; colours interpolate automatically.
- 6Tune the revealChange the per-column stagger, the growth duration, or the ScrollTrigger end value to speed up or slow the build.
Real-world uses
Common Use Cases
Got questions?
Frequently Asked Questions
Animating a rectangle height grows it from its centre in both directions, which looks wrong for a chart. Placing each bar so its body sits above a base-aligned group origin and animating only the vertical scale from 0 to 100 stretches the bar upward from the baseline, exactly like a real column filling. It also keeps the animation to a single property per bar, which is simpler and cheaper than animating both height and position.
Because lottie-web treats an animated keyframe with no i/o easing tangents as a hold keyframe — it never interpolates, so a scale keyframed 0 to 100 stays stuck at 0 and the bar never grows. The keyframe helper in this snippet attaches linear tangents to every keyframe. If you hand-edit a keyframe and a bar stops growing, missing tangents are the first thing to check.
Edit the HEIGHTS array — each value from 0 to 1 is a bar height as a fraction of the maximum — and change N to match the number of bars. The x positions, colours, and stagger all derive from the index, so they adapt automatically. For labels or axis ticks, add more shape layers positioned along the baseline, or overlay HTML text on top of the pinned stage.
play runs the animation on its internal clock, which is exactly what you do not want when scroll should control it. goToAndStop(frame, true) renders one specific still frame and never starts the timer — the second argument tells lottie-web the value is a frame number, not milliseconds. Multiplying scroll progress by totalFrames gives the frame to show, and fractional frames interpolate smoothly so the growth is continuous.
Yes. Click JSX for a React component, Vue for a Vue 3 SFC, Angular for a standalone component, or Tailwind for a React + Tailwind version. Call lottie.loadAnimation against a ref inside a mount effect, register the ScrollTrigger there, and on cleanup call anim.destroy() and kill the ScrollTrigger instance (or revert a gsap.context) so the SVG and scroll listener are released on unmount.