
Learn Coding Visually
Learn to code with interactive, live-preview playgrounds — HTML, CSS, JavaScript, React & more.
 HTML Playground42 lessons · Click-based · Live preview
 CSS PlaygroundLearn CSS with a live editor
 JavaScript Playground60 lessons · DOM · Async · Canvas
 React PlaygroundLearn React with a live code editor
 GSAP PlaygroundLearn GSAP animation interactively
 SVG Playground44 lessons · shapes · paths · animation
 SCSS Playground45 lessons · Sass modules · tokens
 Tailwind PlaygroundLearn Tailwind CSS with a live editor
 Bootstrap 5 Playground50 lessons · live preview
Leaflet Marker Clustering at Scale — Free HTML CSS JS Snippet
Leaflet Marker Clustering at Scale · Misc · Plain HTML, CSS & JS · Live preview
What's included
Features
About this UI Snippet
Leaflet Marker Clustering at Scale — Why 2,000 Pins Need a Second Library
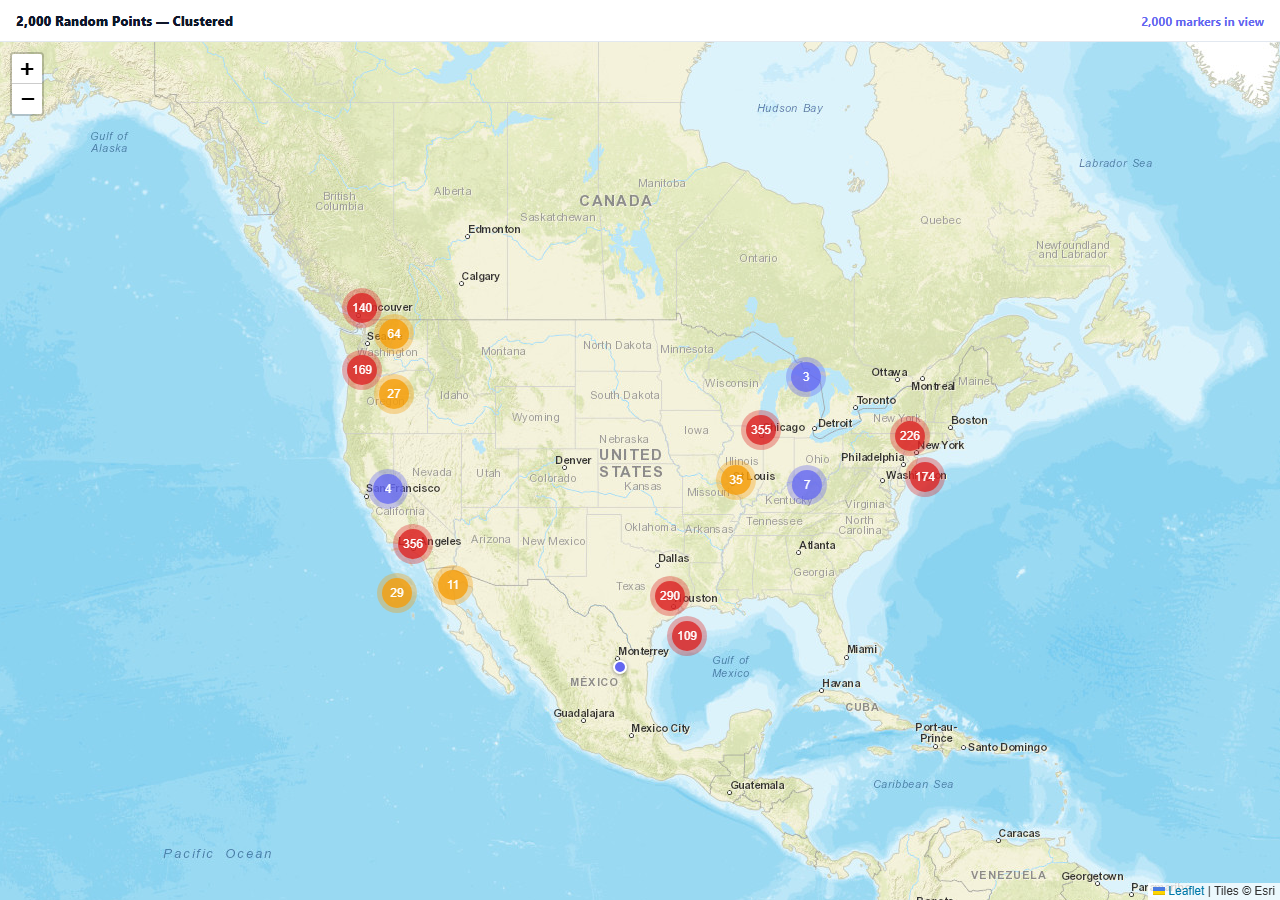
Plotting a few dozen markers on a Leaflet map is one line each. Plotting two thousand is a different problem entirely: at a country-wide zoom level, most of those pins overlap into an unreadable smear, and the browser is rendering DOM elements for markers nobody can currently distinguish. The Leaflet.markercluster plugin exists specifically for this — it groups nearby markers into a single numbered bubble at low zoom, and un-groups them automatically as you zoom in.
Markers join a cluster group, not the map directly
The core API change from a plain Leaflet map is where markers get added: instead of marker.addTo(map), every marker is added to an L.markerClusterGroup() instance via cluster.addLayer(m), and that one cluster group — itself a Leaflet layer — is what actually gets added to the map. The plugin decides at render time, based on current zoom and marker density, whether a given area shows individual pins or one aggregate bubble.
Cluster size drives cluster color
The three-tier color coding (small/medium/large cluster CSS classes) comes for free from the plugin's default styling, keyed to how many markers a bubble represents — it's a visual density cue that requires no counting logic in application code, just CSS targeting the classes the plugin already assigns.
spiderfyOnMaxZoom solves the "can't zoom in further" case
At the map's maximum zoom level, multiple markers can still occupy the exact same pixel — zooming in further isn't possible, so clustering can't resolve them by more zoom alone. spiderfyOnMaxZoom: true handles that specific case by fanning overlapping markers out into a small radial pattern on click, so even markers at identical coordinates stay individually clickable.
The visible-count readout is computed from real map bounds
The header count isn't the total marker count — it's recalculated on every moveend by checking which markers actually fall inside map.getBounds(), which is what makes it accurately track "how many of the 2,000 points are in my current view" as you pan and zoom, not a static number that never changes.
Reusing it
This scales to real datasets of thousands of points — store locations, sensor readings, incident reports — by swapping the generated HOTSPOTS-based points for real coordinates from an API or database; the cluster group itself doesn't care where the marker data came from.
Build with AI
Build, Understand, Optimize, and Extend It With AI
You don't have to figure out density-based clustering algorithms yourself. Paste this snippet's HTML, CSS, and JS into an AI coding assistant like Claude and ask it to explain exactly how Leaflet.markercluster decides whether a region of the map renders as individual pins or an aggregate bubble, and why spiderfyOnMaxZoom is needed even though clustering already handles most density problems. The same assistant can help optimize it — ask whether generating and clustering 2,000 markers up front is fast enough, or whether a real production dataset in the tens of thousands should instead load markers incrementally based on the current viewport. It's also useful for extending the effect: ask it to add a category filter that re-clusters only markers matching a selected type, custom popup content per marker, or a heatmap toggle as an alternative density view. Treat the code less like a finished artifact and more like a starting point for a conversation.
Prompt to recreate it
Copy this into your AI assistant of choice to build the effect from scratch, or as a jumping-off point for your own variant:
Build a map that clusters a large number of markers (around 2,000) into density-based groups using Leaflet.js with the Leaflet.markercluster plugin (load Leaflet's and the plugin's CSS and JS from a CDN, no other library), in plain HTML, CSS, and JavaScript.

Requirements:
- Generate around 2,000 marker coordinates clustered loosely around a handful of real-world hotspot locations (rather than uniformly random across the whole map), so zooming in reveals realistic variation in density between regions.
- Add every marker to a marker-clustering layer group (not directly to the map), so the library automatically groups nearby markers into a single numbered bubble at low zoom levels and progressively reveals individual markers as the user zooms into a cluster.
- Style the cluster bubbles with at least three visually distinct color tiers based on how many markers each bubble currently represents (e.g. small clusters in one color, medium in another, large clusters in a third), using the clustering library's own size classification rather than counting markers yourself.
- Enable the library's built-in behavior for fanning out ("spiderfying") individually overlapping markers when the map is already at its maximum zoom level and a cluster bubble at that zoom is clicked, since zooming in further isn't possible at that point.
- Show a live count above the map of how many markers currently fall within the visible map bounds, recalculating it every time the map is panned or zoomed by checking each marker's coordinates against the map's current bounding box.
- Use free OpenStreetMap tile layers so the demo requires no API key.
Want to tighten it up first? Run this prompt through the AI Prompt Studio to score it across 8 quality dimensions, catch anti-patterns, and tune the wording for Claude, ChatGPT, or Gemini before you paste it in.
Source Code
<div class="mc-wrap">
  <div class="mc-bar">
    <div class="mc-title">2,000 Random Points — Clustered</div>
    <div class="mc-count" id="mcCount">0 markers currently visible</div>
  </div>
  <div class="mc-map" id="mcMap"></div>
</div>*{box-sizing:border-box;margin:0;padding:0}
body{font-family:system-ui,-apple-system,sans-serif;background:#f8fafc}
.mc-wrap{height:100vh;min-height:480px;display:flex;flex-direction:column}
.mc-bar{padding:12px 16px;background:#fff;border-bottom:1px solid #e2e8f0;display:flex;justify-content:space-between;align-items:center;flex-wrap:wrap;gap:8px}
.mc-title{font-size:13px;font-weight:800;color:#0f172a}
.mc-count{font-size:12px;font-weight:700;color:#6366f1}
.mc-map{flex:1}
.mc-pin{background:#6366f1;width:14px;height:14px;border-radius:50%;border:2px solid #fff;box-shadow:0 1px 4px rgba(0,0,0,.4)}
.marker-cluster-small{background-color:rgba(99,102,241,.35)}
.marker-cluster-small div{background-color:rgba(99,102,241,.75);color:#fff}
.marker-cluster-medium{background-color:rgba(245,158,11,.35)}
.marker-cluster-medium div{background-color:rgba(245,158,11,.8);color:#fff}
.marker-cluster-large{background-color:rgba(220,38,38,.35)}
.marker-cluster-large div{background-color:rgba(220,38,38,.8);color:#fff}var map = L.map('mcMap').setView([39.5, -98.35], 4);
L.tileLayer('https://server.arcgisonline.com/ArcGIS/rest/services/World_Street_Map/MapServer/tile/{z}/{y}/{x}', {
attribution: 'Tiles © Esri',
maxZoom: 19,
}).addTo(map);
// A cluster group is itself a Leaflet layer -- individual markers are added
// to IT, not to the map directly, and it decides at render time whether to
// show them as one number bubble or fan them out to individual pins.
var cluster = L.markerClusterGroup({
maxClusterRadius: 60,
spiderfyOnMaxZoom: true,
showCoverageOnHover: false,
});
var pinIcon = L.divIcon({ className: 'mc-pin', iconSize: [14, 14] });
// 2,000 deterministic pseudo-random points clustered loosely around a few
// "hot" regions, so zooming in reveals realistic density variation rather
// than uniform noise.
function seededRandom(seed) {
var x = Math.sin(seed) * 10000;
return x - Math.floor(x);
}
var HOTSPOTS = [
{ lat: 40.7, lng: -74.0 }, // NYC
{ lat: 34.05, lng: -118.24 }, // LA
{ lat: 41.88, lng: -87.63 }, // Chicago
{ lat: 29.76, lng: -95.37 }, // Houston
{ lat: 47.61, lng: -122.33 }, // Seattle
];
var markers = [];
for (var i = 0; i < 2000; i++) {
var hs = HOTSPOTS[i % HOTSPOTS.length];
var spread = 4 + seededRandom(i * 3.1) * 6;
var lat = hs.lat + (seededRandom(i * 1.7) - 0.5) * spread;
var lng = hs.lng + (seededRandom(i * 2.3 + 1) - 0.5) * spread;
var m = L.marker([lat, lng], { icon: pinIcon });
markers.push(m);
cluster.addLayer(m);
}
map.addLayer(cluster);
var countEl = document.getElementById('mcCount');
function updateCount() {
var bounds = map.getBounds();
var visible = markers.filter(function (m) { return bounds.contains(m.getLatLng()); }).length;
countEl.textContent = visible.toLocaleString('en-US') + ' markers in view';
}
map.on('moveend', updateCount);
updateCount();Step by step
How to Use
- 1Add the Leaflet and markercluster CDNsBoth CSS files plus both JS files, Leaflet first.
- 2Paste HTML, CSS, and JS2,000 points render as color-coded cluster bubbles.
- 3Zoom in on a hotspotBubbles split into smaller bubbles, then individual pins.
- 4Zoom to maximum on a dense areaOverlapping pins spiderfy into a fanned-out pattern.
- 5Pan the mapThe header count updates to markers currently in view.
- 6Click a cluster bubbleThe map zooms in to reveal what's inside it.
Real-world uses
Common Use Cases
Got questions?
Frequently Asked Questions
The cluster group (L.markerClusterGroup()) is itself a Leaflet layer that manages a whole collection of markers — it decides, based on the current zoom and how close markers are to each other, whether to render a given area as individual pins or one numbered bubble. Adding a marker directly to the map would bypass that logic entirely and just render every marker individually regardless of density, defeating the purpose of clustering.
Once the map is at its maximum zoom level, zooming in further isn't possible, so markers that sit at the exact same or very close coordinates can no longer be visually separated by more zoom. spiderfyOnMaxZoom: true handles that specific edge case by fanning overlapping markers out into a small radial arrangement when their cluster bubble is clicked at max zoom, keeping every marker individually clickable even when zoom can't separate them.
The plugin assigns one of three CSS classes (marker-cluster-small/medium/large) to each cluster bubble based on how many markers it currently represents, and the actual colors come from CSS rules targeting those classes. No application code counts markers or picks colors — the density-to-color mapping is a styling layer on top of a classification the plugin already computes.
A moveend listener re-filters the full markers array on every pan or zoom, keeping only the ones whose coordinates fall inside the map's current bounds (map.getBounds()), and updates the header text with that filtered count. This means the number always reflects what's actually in view, not a static total that would be misleading once you've panned away from the full dataset.
Replace the generated points loop with your own array of coordinates (from an API response or database query), keeping the same pattern of creating an L.marker per point and adding it to the cluster group with cluster.addLayer(). Everything else — the clustering, spiderfying, color coding, and visible-count readout — works unchanged regardless of where the coordinate data came from.