Learn Coding Visually
Learn to code with interactive, live-preview playgrounds — HTML, CSS, JavaScript, React & more.
 HTML Playground42 lessons · Click-based · Live preview
 CSS PlaygroundLearn CSS with a live editor
 JavaScript Playground60 lessons · DOM · Async · Canvas
 React PlaygroundLearn React with a live code editor
 GSAP PlaygroundLearn GSAP animation interactively
 SVG Playground44 lessons · shapes · paths · animation
 SCSS Playground45 lessons · Sass modules · tokens
 Tailwind PlaygroundLearn Tailwind CSS with a live editor
 Bootstrap 5 Playground50 lessons · live preview
ECharts Live-Updating Realtime Chart — Free Streaming Snippet
ECharts Live-Updating Realtime Chart · Dashboards · Plain HTML, CSS & JS · Live preview
What's included
Features
About this UI Snippet
ECharts Live-Updating Realtime Chart — a Sliding Window, Not a Growing List
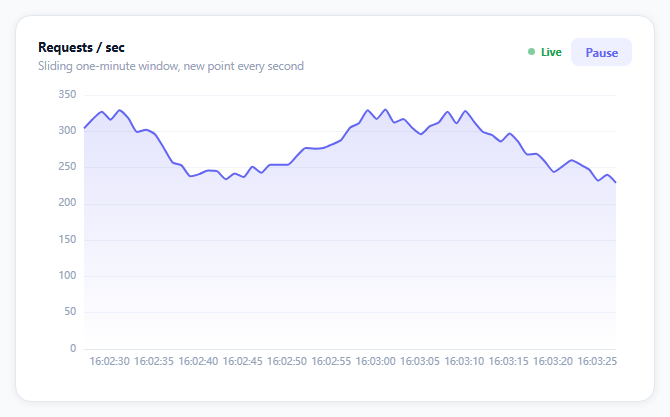
A realtime chart has one requirement a static chart doesn't: it has to keep updating forever without its data array — or its render cost — growing forever. This snippet shows the correct shape for that: a fixed-size sliding window over a time axis, one new point pushed and one old point dropped every second, with a pause control for when you actually need to read a specific moment.
A time axis, not a category axis
The x-axis is type: 'time', taking real millisecond timestamps rather than string labels. That's what lets ECharts compute even, human-readable tick spacing on its own and what makes the sliding-window trick possible — a category axis has no numeric distance between labels to compare against a cutoff timestamp.
The window slides by trimming, not by resetting
Every tick, one new [timestamp, value] pair is pushed onto the data array, and then a while loop shifts off every point older than WINDOW seconds from the *front*. Because timestamps are monotonically increasing and points are always added at the end, the oldest points are always at the start of the array — so a single while (data[0][0] < cutoff) data.shift() is enough to keep the array bounded without ever scanning the whole thing.
setOption with partial data, not a full re-render
The interval handler calls chart.setOption({ series: [{ data: data }] }) — not a full option rebuild. ECharts merges partial options into the existing chart configuration, so the axes, styling, and tooltip formatter set up once at chart.setOption(option) are left untouched; only the series data actually changes on every tick, which is both less code and cheaper to render at 1Hz than reconstructing the whole option object every second.
animationDurationUpdate keeps ticks smooth, not jerky
Setting a short update-transition duration (300ms) is what makes each new point animate into place instead of snapping — long enough to read as motion, short enough not to lag behind the next second's tick.
Pause is a flag, not a timer stop
The toggle button doesn't clear the setInterval — it flips a running boolean the interval checks before doing anything. That's a deliberate simplification: stopping and restarting the interval itself would need to account for the exact same behavior, so gating the body of an always-running interval is simpler and just as correct.
Reusing it
Point the interval body at a real data source — a WebSocket message handler, an EventSource onmessage, a short-poll fetch — instead of Math.random(), and everything else (the sliding window, the partial setOption, the pause control) keeps working unchanged, since none of it depends on where the numbers come from.
Build with AI
Build, Understand, Optimize, and Extend It With AI
You don't have to work out sliding-window memory management from scratch. Paste this snippet's HTML, CSS, and JS into an AI coding assistant like Claude and ask it to explain exactly how the while-loop trim at the front of the data array keeps memory bounded given that new points are always appended at the end in increasing time order, and why calling setOption with only the changed series data is more efficient than rebuilding the whole option object on every one-second tick. The same assistant can help optimize it — ask whether a 60-second window and 1-second update interval is the right density for readability versus performance, and whether the pause implementation (gating an always-running interval) could leak if the page is backgrounded for a long time. It's also useful for extending the effect: ask it to connect the data source to a real WebSocket or Server-Sent Events endpoint, add a second overlaid metric line, or add a way to export the currently visible window's data as CSV. Treat the code less like a finished artifact and more like a starting point for a conversation.
Prompt to recreate it
Copy this into your AI assistant of choice to build the effect from scratch, or as a jumping-off point for your own variant:
Build a realtime, continuously-updating line chart using Apache ECharts (load echarts from a CDN, no other library), in plain HTML, CSS, and JavaScript.

Requirements:
- Use a real time-based x-axis (taking actual millisecond timestamps, not string category labels) so the chart can compute its own tick spacing and support numeric comparisons against a cutoff time.
- Seed the chart with about a minute of initial data points spaced one second apart, then every second push exactly one new timestamped data point representing a live-updating metric (for example simulated requests per second via a bounded random walk).
- Implement a genuine sliding window: after adding each new point, remove any points from the beginning of the data array that are older than the visible window duration (for example 60 seconds), so the underlying data array's size stays roughly constant over time instead of growing without bound as the chart keeps running.
- Update the chart on each tick by passing only the changed series data to the charting library's option-updating method, relying on it to merge that into the existing configuration, rather than reconstructing and reapplying the chart's entire configuration object every second.
- Give the new-point animation a short, smooth transition duration so each tick's new point eases into place rather than appearing instantly or animating too slowly to keep up with the next tick.
- Add a Pause/Resume button that stops new points from being added or the chart from updating while paused (without destroying the chart or losing existing data), and resumes exactly where it left off when clicked again, plus a small live-status indicator that visually reflects whether the stream is currently running or paused.
- Show a tooltip on hover displaying the exact time (formatted as hours:minutes:seconds) and value of the hovered point.
- Keep the chart instance responsive to its container being resized by calling the chart's resize method whenever the container's size changes.
Want to tighten it up first? Run this prompt through the AI Prompt Studio to score it across 8 quality dimensions, catch anti-patterns, and tune the wording for Claude, ChatGPT, or Gemini before you paste it in.
Source Code
<div class="elv-wrap">
  <div class="elv-card">
    <div class="elv-head">
      <div>
        <div class="elv-title">Requests / sec</div>
        <div class="elv-sub">Sliding one-minute window, new point every second</div>
      </div>
      <div class="elv-controls">
        <span class="elv-live" id="elvLive"><span class="elv-dot"></span>Live</span>
        <button class="elv-btn" id="elvToggle" type="button">Pause</button>
      </div>
    </div>
    <div class="elv-chart" id="elvChart"></div>
  </div>
</div>*{box-sizing:border-box;margin:0;padding:0}
body{font-family:system-ui,-apple-system,sans-serif;background:#f8fafc;min-height:100vh;display:flex;align-items:center;justify-content:center;padding:24px}
.elv-wrap{width:100%;max-width:640px}
.elv-card{background:#fff;border-radius:16px;padding:22px;box-shadow:0 1px 8px rgba(0,0,0,.07);border:1px solid #e2e8f0}
.elv-head{display:flex;justify-content:space-between;align-items:flex-start;gap:12px;margin-bottom:6px}
.elv-title{font-size:13px;font-weight:700;color:#0f172a}
.elv-sub{font-size:11.5px;color:#94a3b8;margin-top:3px}
.elv-controls{display:flex;align-items:center;gap:10px}
.elv-live{display:flex;align-items:center;gap:6px;font:700 11px system-ui,sans-serif;color:#16a34a}
.elv-dot{width:7px;height:7px;border-radius:50%;background:#16a34a;animation:elvPulse 1.4s ease-in-out infinite}
.elv-live.paused{color:#94a3b8}
.elv-live.paused .elv-dot{background:#94a3b8;animation:none}
@keyframes elvPulse{0%,100%{opacity:1}50%{opacity:.3}}
.elv-btn{background:#eef0ff;color:#6366f1;border:none;border-radius:8px;padding:6px 14px;font:700 12px system-ui,sans-serif;cursor:pointer}
.elv-btn:hover{background:#e0e4ff}
.elv-chart{width:100%;height:300px}var el = document.getElementById('elvChart');
var toggleBtn = document.getElementById('elvToggle');
var liveEl = document.getElementById('elvLive');
var chart = echarts.init(el);
var WINDOW = 60; // seconds visible at once
var value = 320;
var data = [];
var now = Date.now();
for (var i = WINDOW; i >= 0; i--) {
value = Math.max(60, value + (Math.random() * 40 - 20));
data.push([now - i * 1000, Math.round(value)]);
}
var option = {
animationDurationUpdate: 300,
grid: { left: 46, right: 16, top: 16, bottom: 30 },
tooltip: {
trigger: 'axis',
backgroundColor: '#0f172a',
borderWidth: 0,
textStyle: { color: '#fff', fontSize: 12 },
axisPointer: { type: 'line' },
formatter: function (p) {
var d = new Date(p[0].data[0]);
var t = String(d.getHours()).padStart(2, '0') + ':' + String(d.getMinutes()).padStart(2, '0') + ':' + String(d.getSeconds()).padStart(2, '0');
return t + '<br/><b>' + p[0].data[1] + '</b> req/s';
},
},
xAxis: {
type: 'time',
axisLine: { lineStyle: { color: '#e2e8f0' } },
axisLabel: {
color: '#94a3b8',
fontSize: 10,
formatter: function (v) {
var d = new Date(v);
return String(d.getHours()).padStart(2, '0') + ':' + String(d.getMinutes()).padStart(2, '0') + ':' + String(d.getSeconds()).padStart(2, '0');
},
},
axisTick: { show: false },
},
yAxis: {
type: 'value',
axisLabel: { color: '#94a3b8', fontSize: 10 },
splitLine: { lineStyle: { color: '#f1f5f9' } },
},
series: [{
type: 'line',
data: data,
smooth: 0.2,
symbol: 'none',
lineStyle: { width: 2, color: '#6366f1' },
areaStyle: {
color: {
type: 'linear', x: 0, y: 0, x2: 0, y2: 1,
colorStops: [
{ offset: 0, color: 'rgba(99,102,241,.25)' },
{ offset: 1, color: 'rgba(99,102,241,0)' },
],
},
},
}],
};
chart.setOption(option);
var running = true;
var timer = setInterval(function () {
if (!running) return;
var last = data[data.length - 1][1];
var next = Math.max(60, last + (Math.random() * 40 - 20));
data.push([Date.now(), Math.round(next)]);
// Slide the window: drop points older than WINDOW seconds so the series
// never grows unbounded and the x-axis always shows the trailing minute.
var cutoff = Date.now() - WINDOW * 1000;
while (data.length && data[0][0] < cutoff) data.shift();
chart.setOption({ series: [{ data: data }] });
}, 1000);
toggleBtn.addEventListener('click', function () {
running = !running;
toggleBtn.textContent = running ? 'Pause' : 'Resume';
liveEl.classList.toggle('paused', !running);
liveEl.lastChild.textContent = running ? 'Live' : 'Paused';
});
var ro = new ResizeObserver(function () { chart.resize(); });
ro.observe(el);Step by step
How to Use
- 1Add the ECharts CDNLoad echarts.min.js before the snippet's JS runs.
- 2Paste HTML, CSS, and JSA live line starts streaming immediately, one point per second.
- 3Watch the window slideOld points drop off the left as new ones enter on the right.
- 4Click PauseThe line freezes so you can read a specific moment.
- 5Click ResumeStreaming continues exactly where it left off.
- 6Hover any pointThe tooltip shows the exact time and value.
Real-world uses
Common Use Cases
Got questions?
Frequently Asked Questions
Every second, one new [timestamp, value] point is pushed onto the data array, and then a while loop removes points from the front of the array as long as their timestamp is older than the window cutoff (now minus 60 seconds). Because points are always appended in increasing time order, the oldest ones are always at the start, so this trimming keeps the array's length roughly constant instead of growing without bound.
A time axis takes real millisecond timestamps and lets ECharts compute its own readable tick spacing, and — more importantly for this snippet — gives every data point a real numeric position that can be compared against a cutoff timestamp for trimming. A category axis only has string labels with no inherent numeric distance, which would make the sliding-window trim logic much harder to implement correctly.
ECharts merges a partial option object into whatever configuration is already applied, rather than requiring the full option every time. Since the axes, tooltip formatter, and styling were already set on the first setOption call and never change, passing just the updated series data on every tick is both simpler and cheaper to compute than reconstructing and re-applying the entire option object every second.
The setInterval callback keeps running every second regardless of pause state, but its first action is checking a running boolean and returning immediately if it is false. This means pausing is just gating the interval's body rather than clearing and later recreating the timer, which is simpler code and behaves identically to a genuinely paused stream from the viewer's perspective.
Replace the setInterval body's random-walk calculation with a handler for your real source — a WebSocket onmessage, an EventSource listener, or a short-poll fetch — that pushes a [Date.now(), realValue] pair onto the same data array and runs the same trim-and-setOption logic already present. Everything downstream, including the sliding window and the pause control, needs no changes.