Learn Coding Visually
Learn to code with interactive, live-preview playgrounds — HTML, CSS, JavaScript, React & more.
 HTML Playground42 lessons · Click-based · Live preview
 CSS PlaygroundLearn CSS with a live editor
 JavaScript Playground60 lessons · DOM · Async · Canvas
 React PlaygroundLearn React with a live code editor
 GSAP PlaygroundLearn GSAP animation interactively
 SVG Playground44 lessons · shapes · paths · animation
 SCSS Playground45 lessons · Sass modules · tokens
 Tailwind PlaygroundLearn Tailwind CSS with a live editor
 Bootstrap 5 Playground50 lessons · live preview
Leaflet GeoJSON Region Choropleth — Free HTML CSS JS Snippet
Leaflet GeoJSON Region Choropleth · Charts · Plain HTML, CSS & JS · Live preview
What's included
Features
About this UI Snippet
Leaflet GeoJSON Region Choropleth — Coloring Real Polygon Boundaries by Value
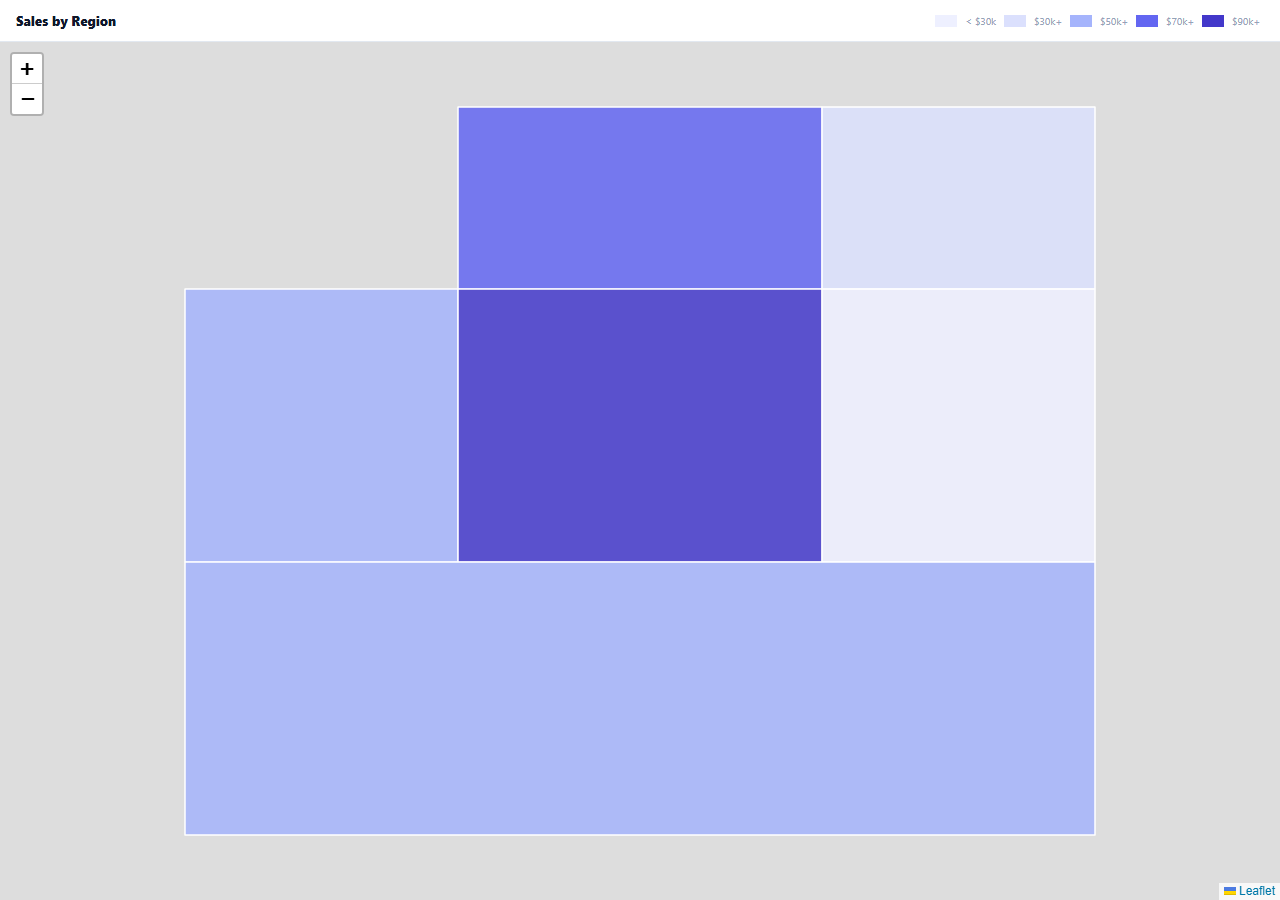
A choropleth map colors regions by a data value — sales by state, population by county, cases by country — and the regions have to be real geographic boundaries, not approximated circles or squares. Leaflet's L.geoJSON renders exactly that: actual polygon geometry from a GeoJSON feature collection, styled per-feature from whatever properties each feature carries.
Color comes from a threshold function, not a rank
colorFor(v) buckets each region's sales figure against fixed dollar thresholds ($90k, $70k, $50k, $30k), not by sorting regions and coloring the top N differently. That distinction matters: a threshold scale means a region's color reflects its actual absolute performance, and adding a seventh region next year doesn't silently recolor the other six the way a rank-based scheme would.
Hover styling and the tooltip are driven by real Leaflet layer events
Each GeoJSON feature becomes its own Leaflet layer via onEachFeature, and that layer fires its own mouseover/mousemove/mouseout events — the same event model as any other Leaflet shape. mouseover temporarily darkens the region's border and boosts its fill; mouseout calls geoLayer.resetStyle(), which restores the exact original style Leaflet computed from styleFor, not a hardcoded fallback that could drift out of sync with the color scale.
The tooltip follows the cursor via container-point conversion
Because the tooltip here is a plain positioned <div>, not Leaflet's built-in popup, its position has to be computed manually: map.latLngToContainerPoint(e.latlng) converts the hovered geographic point into pixel coordinates relative to the map's container, which is what lets the tooltip track the cursor smoothly on mousemove rather than jumping to a fixed anchor.
Click-to-zoom uses the feature's own bounds
Clicking a region calls map.fitBounds(layer.getBounds()) — every GeoJSON layer knows its own bounding box, so zooming to "fit this exact region" requires no manual coordinate math, regardless of how large or oddly-shaped that region's polygon is.
Reusing it
Swap the simplified six-region REGIONS object for a real GeoJSON file (US states, world countries, ZIP codes — many are freely available), keep the same properties.sales-style value on each feature, and the coloring, hover, and click-to-zoom logic all keep working unchanged.
Build with AI
Build, Understand, Optimize, and Extend It With AI
You don't have to work out per-feature styling and event binding from scratch. Paste this snippet's HTML, CSS, and JS into an AI coding assistant like Claude and ask it to explain exactly how onEachFeature attaches individual hover and click behavior to each GeoJSON polygon, and why resetStyle is more reliable than manually restoring a hardcoded default style on mouseout. The same assistant can help optimize it — ask whether the fixed dollar-threshold color scale should instead be computed dynamically from the actual min/max values in the dataset (a quantile scale), which would generalize better to a dataset with very different value ranges. It's also useful for extending the effect: ask it to add a real GeoJSON file for US states or world countries, a data-driven legend that adjusts its thresholds automatically, or a time slider that recolors the whole map as a selected date changes. Treat the code less like a finished artifact and more like a starting point for a conversation.
Prompt to recreate it
Copy this into your AI assistant of choice to build the effect from scratch, or as a jumping-off point for your own variant:
Build a choropleth map that colors real geographic regions by a numeric data value using Leaflet.js and GeoJSON (load Leaflet's CSS and JS from a CDN, no other library), in plain HTML, CSS, and JavaScript.

Requirements:
- Define a GeoJSON FeatureCollection of several region polygons, each carrying a name and a numeric value (for example sales figures) in its properties.
- Render the GeoJSON on the map with each region's fill color determined by comparing its value against a set of fixed thresholds (not by ranking regions relative to each other), so a region's color reflects its real absolute value and stays consistent even if other regions are added or removed later.
- On hovering a region, visually highlight it (a darker border and higher fill opacity) and show a tooltip that follows the cursor displaying that region's name and exact value, converting the hovered geographic coordinate to pixel coordinates to position the tooltip. On mouseout, restore the region to its originally computed style using the mapping library's own style-reset capability rather than a separately hardcoded default style.
- On clicking a region, zoom and pan the map to fit exactly that region's boundary using its own geometry's bounding box, without manually calculating coordinates for each region.
- Render a color legend showing which value range each color band represents.
- Fit the map's initial view to the full extent of all regions when the page loads.
Want to tighten it up first? Run this prompt through the AI Prompt Studio to score it across 8 quality dimensions, catch anti-patterns, and tune the wording for Claude, ChatGPT, or Gemini before you paste it in.
Source Code
<div class="cp-wrap">
  <div class="cp-bar">
    <div class="cp-title">Sales by Region</div>
    <div class="cp-legend" id="cpLegend"></div>
  </div>
  <div class="cp-map" id="cpMap"></div>
  <div class="cp-tooltip" id="cpTooltip"></div>
</div>*{box-sizing:border-box;margin:0;padding:0}
body{font-family:system-ui,-apple-system,sans-serif}
.cp-wrap{height:100vh;min-height:480px;display:flex;flex-direction:column;position:relative}
.cp-bar{padding:12px 16px;background:#fff;border-bottom:1px solid #e2e8f0;display:flex;justify-content:space-between;align-items:center;flex-wrap:wrap;gap:10px}
.cp-title{font-size:13px;font-weight:800;color:#0f172a}
.cp-legend{display:flex;align-items:center;gap:4px}
.cp-swatch{width:22px;height:12px}
.cp-legend-label{font-size:10px;color:#94a3b8;margin:0 4px}
.cp-map{flex:1}
.cp-tooltip{position:absolute;pointer-events:none;background:#0f172a;color:#fff;font-size:12px;font-weight:700;padding:6px 10px;border-radius:7px;transform:translate(-50%,-130%);display:none;white-space:nowrap;z-index:1000}// A simplified 6-region GeoJSON so the whole demo is self-contained --
// real usage swaps this for a real states/countries GeoJSON file.
var REGIONS = {
type: 'FeatureCollection',
features: [
{ type: 'Feature', properties: { name: 'North', sales: 82000 }, geometry: { type: 'Polygon', coordinates: [[[-2,2],[2,2],[2,4],[-2,4],[-2,2]]] } },
{ type: 'Feature', properties: { name: 'North-East', sales: 41000 }, geometry: { type: 'Polygon', coordinates: [[[2,2],[5,2],[5,4],[2,4],[2,2]]] } },
{ type: 'Feature', properties: { name: 'West', sales: 63000 }, geometry: { type: 'Polygon', coordinates: [[[-5,-1],[-2,-1],[-2,2],[-5,2],[-5,-1]]] } },
{ type: 'Feature', properties: { name: 'Central', sales: 95000 }, geometry: { type: 'Polygon', coordinates: [[[-2,-1],[2,-1],[2,2],[-2,2],[-2,-1]]] } },
{ type: 'Feature', properties: { name: 'East', sales: 27000 }, geometry: { type: 'Polygon', coordinates: [[[2,-1],[5,-1],[5,2],[2,2],[2,-1]]] } },
{ type: 'Feature', properties: { name: 'South', sales: 54000 }, geometry: { type: 'Polygon', coordinates: [[[-5,-4],[5,-4],[5,-1],[-5,-1],[-5,-4]]] } },
],
};
var map = L.map('cpMap').setView([0, 0], 6);
// A 5-stop sequential scale, chosen by real value thresholds rather than
// evenly-spaced ranks -- so a region has to actually cross a meaningful
// sales figure to move up a color band, not just outrank its neighbors.
function colorFor(v) {
return v > 90000 ? '#4338ca' :
v > 70000 ? '#6366f1' :
v > 50000 ? '#a5b4fc' :
v > 30000 ? '#dbe0fd' : '#eef0ff';
}
function styleFor(feature) {
return { fillColor: colorFor(feature.properties.sales), weight: 1.5, color: '#fff', fillOpacity: 0.85 };
}
var tooltip = document.getElementById('cpTooltip');
var wrap = document.querySelector('.cp-wrap');
function onEachFeature(feature, layer) {
layer.on('mouseover', function (e) {
e.target.setStyle({ weight: 3, color: '#334155', fillOpacity: 1 });
var pt = map.latLngToContainerPoint(e.latlng);
tooltip.textContent = feature.properties.name + ': $' + feature.properties.sales.toLocaleString('en-US');
tooltip.style.left = pt.x + 'px';
tooltip.style.top = pt.y + 'px';
tooltip.style.display = 'block';
});
layer.on('mousemove', function (e) {
var pt = map.latLngToContainerPoint(e.latlng);
tooltip.style.left = pt.x + 'px';
tooltip.style.top = pt.y + 'px';
});
layer.on('mouseout', function (e) {
geoLayer.resetStyle(e.target);
tooltip.style.display = 'none';
});
layer.on('click', function () { map.fitBounds(layer.getBounds()); });
}
var geoLayer = L.geoJSON(REGIONS, { style: styleFor, onEachFeature: onEachFeature }).addTo(map);
map.fitBounds(geoLayer.getBounds(), { padding: [20, 20] });
var legend = document.getElementById('cpLegend');
[['< $30k', '#eef0ff'], ['$30k+', '#dbe0fd'], ['$50k+', '#a5b4fc'], ['$70k+', '#6366f1'], ['$90k+', '#4338ca']].forEach(function (pair) {
var sw = document.createElement('span');
sw.className = 'cp-swatch';
sw.style.background = pair[1];
legend.appendChild(sw);
var lab = document.createElement('span');
lab.className = 'cp-legend-label';
lab.textContent = pair[0];
legend.appendChild(lab);
});Step by step
How to Use
- 1Add the Leaflet CDNLoad leaflet.css and leaflet.js before the snippet's JS runs.
- 2Paste HTML, CSS, and JSSix regions render colored by their sales value.
- 3Hover a regionIt highlights and a tooltip shows its exact value.
- 4Move across regionsThe tooltip follows the cursor and updates per region.
- 5Click a regionThe map zooms to fit that region's exact boundary.
- 6Read the legendIt shows which color band each sales range maps to.
Real-world uses
Common Use Cases
Got questions?
Frequently Asked Questions
colorFor buckets each region against fixed dollar amounts ($90k, $70k, $50k, $30k), so a region's color reflects its actual absolute sales figure. A rank-based scheme (coloring the top N regions one way, the rest another) would make every region's color dependent on how the others happen to perform — adding or removing a region would silently recolor ones that didn't actually change.
The mouseout handler calls geoLayer.resetStyle(e.target), which is a built-in Leaflet GeoJSON layer method that reapplies whatever the original style function (styleFor) computed for that specific feature. This is more reliable than hardcoding a "default" style to restore, since it can never drift out of sync if the color scale or styling logic changes later.
A built-in Leaflet popup opens anchored to a point and requires a click or a bound open/close lifecycle; this snippet wants a lightweight label that continuously follows the cursor during mousemove, which is simpler to implement as a plain div repositioned via map.latLngToContainerPoint() — converting the hovered geographic coordinate into pixel coordinates relative to the map's container — than to fight the popup component's own positioning behavior.
Every Leaflet layer created from a GeoJSON feature exposes getBounds(), which returns that specific feature's real bounding box regardless of its shape or size. Calling map.fitBounds(layer.getBounds()) on click zooms and pans the map to fit that exact box, with no manual calculation of coordinates needed for each region.
Replace the REGIONS object with your real GeoJSON feature collection (many national statistics agencies and open-data portals publish these for free), and make sure each feature's properties object carries whatever value field you want to color by — then update colorFor and the tooltip text to read that field's name. The rest of the rendering, hover, and click logic needs no changes.