Source Code
<div class="np-wrap">
  <div class="np-head">
    <span class="np-label" id="npLabel">Downloading update…</span>
    <span class="np-pct" id="npPct">0%</span>
  </div>
  <div class="np-track"><div class="np-fill" id="npFill"></div></div>
  <div class="np-meta" id="npMeta">Starting…</div>
  <button class="np-run" id="npRun" type="button">Restart download</button>
</div>*{box-sizing:border-box;margin:0;padding:0}
body{font-family:system-ui,-apple-system,sans-serif;background:#f8fafc;min-height:100vh;display:flex;align-items:center;justify-content:center;padding:24px}
.np-wrap{width:100%;max-width:360px;background:#fff;border:1px solid #e2e8f0;border-radius:14px;padding:20px;box-shadow:0 10px 30px rgba(15,23,42,.06)}
.np-head{display:flex;justify-content:space-between;align-items:baseline;margin-bottom:9px}
.np-label{font-size:13px;font-weight:700;color:#1e293b}
.np-pct{font-size:13px;font-weight:800;color:#6366f1;font-variant-numeric:tabular-nums}
.np-track{height:8px;border-radius:5px;background:#eef1f6;overflow:hidden}
.np-fill{height:100%;width:0%;border-radius:5px;background:linear-gradient(90deg,#6366f1,#818cf8)}
.np-fill.np-done{background:#22c55e}
.np-meta{margin-top:8px;font-size:11.5px;color:#94a3b8;font-variant-numeric:tabular-nums}
.np-run{margin-top:14px;width:100%;padding:9px;background:#f1f5f9;color:#475569;border:1px solid #e2e8f0;border-radius:9px;font-size:12.5px;font-weight:700;cursor:pointer;font-family:inherit}
.np-run:hover{background:#e2e8f0}// Real network transfers are almost never linear: they ramp up fast as
// connections open, cruise through a slower middle stretch under real
// throughput variance, then finish in a fast burst as the last small chunks
// land. This simulates that shape honestly with a real accumulating byte
// counter and jittered per-tick throughput \u2014 not a single eased CSS
// transition pretending to be network activity.
var fillEl = document.getElementById('npFill');
var pctEl = document.getElementById('npPct');
var labelEl = document.getElementById('npLabel');
var metaEl = document.getElementById('npMeta');
var runBtn = document.getElementById('npRun');
var TOTAL_BYTES = 42 * 1024 * 1024; // 42 MB, a believable update size
function formatMB(bytes) {
return (bytes / (1024 * 1024)).toFixed(1) + ' MB';
}
function throughputFor(fractionDone) {
// Fast ramp-up (connection warmup), slower cruising middle (real variance),
// fast finish (final small chunks land quickly). Returns bytes/tick.
var base;
if (fractionDone < 0.12) {
base = 900000 * (fractionDone / 0.12); // ramping up
} else if (fractionDone < 0.8) {
base = 900000 * (0.55 + Math.random() * 0.5); // cruising with real jitter
} else {
base = 900000 * (1.3 + Math.random() * 0.9); // final burst
}
// Occasional stall to mimic real congestion / packet loss recovery.
if (Math.random() < 0.03) base *= 0.1;
return Math.max(20000, base);
}
var timerId = null;
function runDownload() {
runBtn.disabled = true;
fillEl.classList.remove('np-done');
labelEl.textContent = 'Downloading update…';
var transferred = 0;
var startedAt = Date.now();
timerId = setInterval(function () {
var fraction = transferred / TOTAL_BYTES;
transferred = Math.min(TOTAL_BYTES, transferred + throughputFor(fraction));
var pct = (transferred / TOTAL_BYTES) * 100;
fillEl.style.width = pct + '%';
pctEl.textContent = Math.floor(pct) + '%';
var elapsedS = (Date.now() - startedAt) / 1000;
var speedMBs = elapsedS > 0 ? (transferred / (1024 * 1024)) / elapsedS : 0;
metaEl.textContent = formatMB(transferred) + ' of ' + formatMB(TOTAL_BYTES) + ' \u00b7 ' + speedMBs.toFixed(1) + ' MB/s';
if (transferred >= TOTAL_BYTES) {
clearInterval(timerId);
fillEl.classList.add('np-done');
labelEl.textContent = 'Download complete';
metaEl.textContent = formatMB(TOTAL_BYTES) + ' \u00b7 finished in ' + elapsedS.toFixed(1) + 's';
runBtn.disabled = false;
}
}, 90);
}
runBtn.addEventListener('click', runDownload);
runDownload();Learn Coding Visually
Learn to code with interactive, live-preview playgrounds — HTML, CSS, JavaScript, React & more.
 HTML Playground42 lessons · Click-based · Live preview
 CSS PlaygroundLearn CSS with a live editor
 JavaScript Playground60 lessons · DOM · Async · Canvas
 React PlaygroundLearn React with a live code editor
 GSAP PlaygroundLearn GSAP animation interactively
 SVG Playground44 lessons · shapes · paths · animation
 SCSS Playground45 lessons · Sass modules · tokens
 Tailwind PlaygroundLearn Tailwind CSS with a live editor
 Bootstrap 5 Playground50 lessons · live preview
Realistic Network Progress Bar — Non-Linear Download Simulation JS
Realistic Network Progress Bar · Loaders · Plain HTML, CSS & JS · Live preview
What's included
Features
About this UI Snippet
Realistic Network Progress Bar \u2014 Simulating Non-Linear Real-World Download Behavior
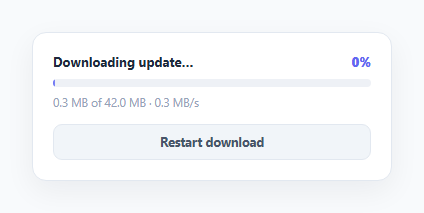
A plain CSS transition: width 3s linear progress bar fills at a perfectly constant rate, which is exactly what real network transfers never do. Real downloads ramp up quickly as connections open, cruise through a variable middle stretch full of throughput jitter, occasionally stall for a moment (packet loss, congestion, a slow chunk), then often finish in a fast final burst as the last small pieces land. This snippet simulates that honestly, computed from a real accumulating byte counter rather than a single eased animation curve.
A real byte counter, not a percentage animation
The whole simulation tracks transferred bytes against a fixed TOTAL_BYTES, incrementing it every tick by a value returned from throughputFor(fractionDone). The displayed percentage, the fill width, and the "X MB of Y MB" meta line are all derived from that one real counter \u2014 there's no separately-animated percentage that could ever drift out of sync with the displayed byte counts, because they're the same number expressed two ways.
Three-phase throughput shape
throughputFor() returns a different byte-per-tick range depending on how far along the transfer is: under 12% done, throughput ramps up linearly from zero (connection warmup); between 12% and 80%, it cruises at a randomized rate with real variance (0.55 + Math.random() * 0.5 of the base rate) rather than a fixed speed; past 80%, it jumps into a faster finishing burst (1.3 to 2.2x base). That fast-slow-fast shape is deliberately the opposite of a typical ease-in-out curve, and it's exactly the shape real download managers, package installers, and browser transfer indicators actually show.
Occasional stalls
On roughly 3% of ticks, throughput is cut to a tenth of its computed value, simulating the brief stalls real transfers experience under congestion or packet loss recovery \u2014 a small but important detail that makes the middle stretch feel authentic rather than smoothly random.
Live, honestly-computed speed readout
The meta line's "MB/s" figure is computed as transferred / elapsedSeconds using the real Date.now() delta since the download started \u2014 an actual average throughput calculation, the same arithmetic a real download manager performs, not a decorative number.
Customizing it
Swap the simulated throughputFor() for real progress events from the Fetch API's ReadableStream reader (response.body.getReader()), the XHR progress event's event.loaded/event.total, or your own upload/download SDK \u2014 the rendering logic only needs a real transferred and total byte count on each update, and works unchanged. Pair it with an async task completion ring for a circular alternative driven by real task counts instead of bytes.
Build with AI
Build, Understand, Optimize, and Extend It With AI
Instead of assuming this is a CSS-eased progress bar with fancy copy, paste this snippet's HTML, CSS, and JS into an AI coding assistant like Claude and ask it to explain exactly how throughputFor() produces its fast-start, variable-middle, fast-finish shape from three separate byte-per-tick ranges keyed to the current completion fraction, and why deriving the percentage and MB/s readout from one real transferred counter avoids the drift that a separately-animated percentage bar could suffer. The same assistant can help optimize it \u2014 for instance asking whether the update interval should scale with tick rate to stay smooth on very large or very small transfers. It's also useful for extending it: ask it to wire the simulation to a real fetch() ReadableStream reader's chunk sizes, add a cancel/pause control that genuinely halts the byte counter, or expose an estimated-time-remaining figure computed from the current throughput trend. Treat the code less like a finished artifact and more like a starting point for a conversation.
Prompt to recreate it
Copy this into your AI assistant of choice to build the effect from scratch, or as a jumping-off point for your own variant:
Build a "realistic" network progress bar in plain HTML, CSS, and JavaScript \u2014 no libraries \u2014 that simulates a non-linear download shape instead of a constant-speed or simple eased CSS width transition.

Requirements:
- Track a real accumulating byte counter against a fixed total byte count in JavaScript, incrementing it on a repeating interval by a computed per-tick amount \u2014 never animate the bar's fill purely via a CSS transition disconnected from real numeric state.
- The per-tick throughput amount must vary based on how far along the transfer currently is: a fast ramp-up from near zero during roughly the first 10\u201315% of the transfer (simulating connection warmup), a slower cruising rate with real random jitter through the middle 60\u201370% of the transfer, and a noticeably faster finishing burst for the final 15\u201320% \u2014 producing an overall fast-slow-fast shape, the opposite of typical ease-in-out easing.
- Introduce occasional brief simulated stalls (a small random chance per tick of a dramatically reduced throughput for that tick) to mimic real-world congestion or retransmission pauses in the middle stretch.
- Display a percentage, a fill bar, an "X MB of Y MB" byte readout, and a live average speed in MB/s \u2014 all computed from the same real transferred-byte counter and a real elapsed-time measurement (not independently animated or hardcoded values).
- Include a button to restart the simulated download with freshly randomized jitter and stall timing on each run, and show a distinct completed state with the total elapsed time once the full byte count is reached.
Want to tighten it up first? Run this prompt through the AI Prompt Studio to score it across 8 quality dimensions, catch anti-patterns, and tune the wording for Claude, ChatGPT, or Gemini before you paste it in.
Step by step
How to Use
- 1Paste HTML, CSS, and JSA download simulation starts immediately with a fast initial ramp-up.
- 2Watch the middle stretchProgress cruises with visible speed variance and the occasional brief stall.
- 3Watch the finishThe last stretch fills noticeably faster, mimicking small final chunks landing quickly.
- 4Read the live MB/s figureThe meta line shows a real average speed computed from elapsed time and bytes transferred.
- 5Click "Restart download"A fresh run begins with new randomized jitter and stall timing.
- 6Wire up a real transferReplace throughputFor with real progress events from fetch(), XHR, or your upload SDK.
Real-world uses
Common Use Cases
Got questions?
Frequently Asked Questions
It tracks a real transferred byte counter against a fixed TOTAL_BYTES value, incrementing it every tick by an amount from throughputFor(). The percentage, fill width, and meta text are all derived directly from that one counter, so they can never drift out of sync the way a separately-animated percentage bar could.
throughputFor() returns different byte-per-tick ranges based on how far along the transfer is: a linear ramp-up under 12% complete (connection warmup), a randomized cruising rate between 12% and 80% (real throughput variance), and a faster finishing burst past 80% (small final chunks landing quickly) \u2014 deliberately mimicking how real network transfers actually behave, rather than a smooth ease-in-out curve.
On about 3% of ticks, the computed throughput is multiplied by 0.1, producing a brief visible stall \u2014 simulating the kind of momentary congestion or packet-loss recovery real transfers experience, which a purely eased CSS animation could never reproduce.
It divides the real transferred byte count (converted to megabytes) by the actual elapsed time in seconds since the download started, using Date.now() timestamps \u2014 the same average-throughput arithmetic a real download manager performs, not a cosmetic number.
Replace the throughputFor()-driven interval with a real progress source: for fetch(), read response.body.getReader() and accumulate the byte length of each chunk; for XHR, use the progress event\u2019s event.loaded and event.total. Feed those real numbers into the same fill-width and meta-text update logic used here.
Yes. Keep transferred and total in state, update transferred inside a real progress event handler (or the same simulated interval for a demo), and derive percentage, fill width, and the MB/s readout from that state on each render \u2014 the throughput-shaping and stall logic ports over unchanged as plain functions.