

Learn Coding Visually
Learn to code with interactive, live-preview playgrounds — HTML, CSS, JavaScript, React & more.
 HTML Playground42 lessons · Click-based · Live preview
 CSS PlaygroundLearn CSS with a live editor
 JavaScript Playground60 lessons · DOM · Async · Canvas
 React PlaygroundLearn React with a live code editor
 GSAP PlaygroundLearn GSAP animation interactively
 SVG Playground44 lessons · shapes · paths · animation
 SCSS Playground45 lessons · Sass modules · tokens
 Tailwind PlaygroundLearn Tailwind CSS with a live editor
 Bootstrap 5 Playground50 lessons · live preview
Leaflet Draw-a-Radius Area Selector — Free HTML CSS JS Snippet
Leaflet Draw-a-Radius Area Selector · Misc · Plain HTML, CSS & JS · Live preview
What's included
Features
About this UI Snippet
Leaflet Draw-a-Radius Area Selector — a Circle Sized in Real Meters
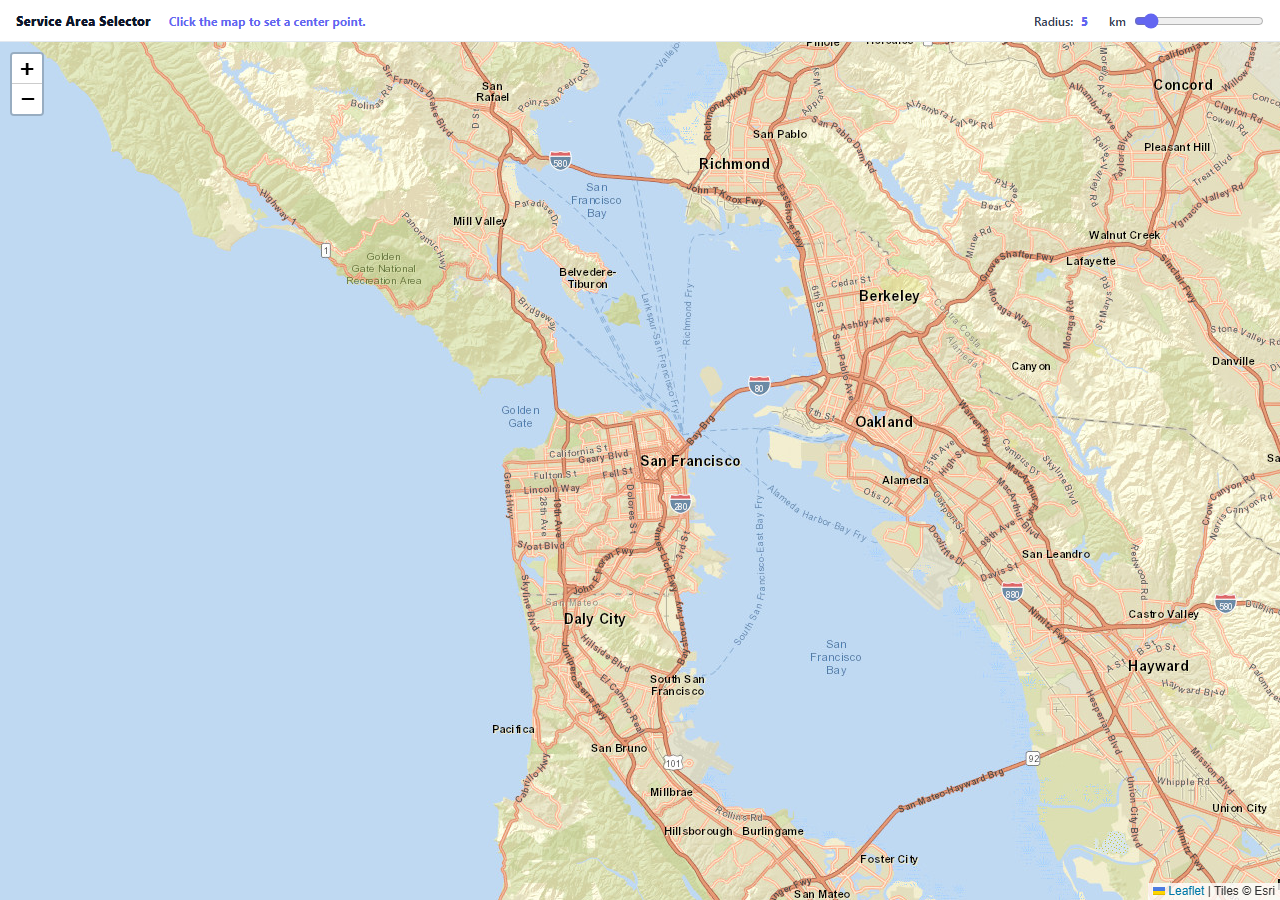
A delivery radius, a service area, a search-within-distance filter — all of them need the same interaction: let someone pick a center point and a distance, and show them exactly what that covers on a map. The tricky part isn't the UI, it's that the circle has to represent a real, consistent geographic distance at every zoom level, not a fixed pixel size.
L.circle takes a radius in meters, not pixels
This is the detail that makes the whole snippet work: L.circle(latlng, { radius: radiusKm * 1000 }) specifies the circle's radius as a real-world distance in meters. Leaflet recomputes its on-screen pixel size every time you zoom, so a 5 km circle always represents 5 actual kilometers on the ground — zoom out and it shrinks on screen while staying 5 km in reality, exactly the behavior a service-area tool needs and a plain SVG circle (sized in pixels) could never provide.
The marker and circle share one drag handler
Once placed, the center marker is draggable, and its drag event handler calls circle.setLatLng() on every movement — not just on drop — so the circle visibly follows the pin in real time instead of snapping into place only after the drag ends. Both the info text and the circle's position update from the same coordinate on every step.
The radius slider updates the existing circle, not a new one
Moving the slider calls circle.setRadius() on the already-placed circle object rather than removing and recreating it — cheaper, and it avoids a visible flicker or the map losing the circle's current center during a rapid slider drag.
Area is computed from the same radius state
The displayed coverage area (Math.PI * km * km) is derived directly from the same radiusKm variable driving the circle itself, so the two numbers — the circle you see and the area figure in the text — can never drift apart or show a stale value from before the last slider move.
Reusing it
This is the base interaction for any radius-based area tool — delivery zones, real estate search radius, "find nearby" filters, broadcast or signal coverage estimates. Swap the info text's copy and hook the finished { lat, lng, radiusKm } values into whatever backend query or filter needs them.
Build with AI
Build, Understand, Optimize, and Extend It With AI
You don't have to work out geographic-versus-pixel sizing yourself. Paste this snippet's HTML, CSS, and JS into an AI coding assistant like Claude and ask it to explain exactly why L.circle's radius being specified in meters rather than pixels is what keeps the circle representing a consistent real-world distance across zoom levels, and why the drag handler updates the circle on every drag event instead of only on dragend. The same assistant can help optimize it — ask whether debouncing the radius slider's input event would meaningfully help performance, and whether the area calculation should account for the Earth's curvature at very large radii rather than treating it as a flat-plane circle. It's also useful for extending the effect: ask it to add a way to draw multiple non-overlapping service areas at once, snap the center point to a searched address instead of a map click, or export the final selection as GeoJSON. Treat the code less like a finished artifact and more like a starting point for a conversation.
Prompt to recreate it
Copy this into your AI assistant of choice to build the effect from scratch, or as a jumping-off point for your own variant:
Build a click-to-place radius selector on an interactive map using Leaflet.js (load Leaflet's CSS and JS from a CDN, no other library), in plain HTML, CSS, and JavaScript.

Requirements:
- Show an empty map and a radius slider (for example 1 to 50, in kilometers) above it; before any point is selected, display a hint telling the user to click the map to set a center point.
- On the first click anywhere on the map, place a draggable marker at that location and draw a circle centered on it, with the circle's radius specified as a real geographic distance (not a fixed pixel size), so the circle's true size in kilometers stays correct regardless of the map's current zoom level.
- Make dragging the marker update the circle's center position continuously throughout the drag gesture (not only once the drag ends), so the circle visibly follows the marker in real time.
- Make moving the radius slider resize the existing circle in place (updating its radius property directly) rather than removing and recreating a new circle object, and update it live as the slider is dragged.
- Display the currently selected radius and the approximate area it covers (computed from that same radius) as text above the map, keeping both numbers derived from one shared radius value so they can never show inconsistent information.
- Clicking the map again after a point has already been placed should move the existing marker and circle to the new location rather than adding a second one.
- Use free OpenStreetMap tile layers so the demo requires no API key.
Want to tighten it up first? Run this prompt through the AI Prompt Studio to score it across 8 quality dimensions, catch anti-patterns, and tune the wording for Claude, ChatGPT, or Gemini before you paste it in.
Source Code
<div class="rs-wrap">
  <div class="rs-bar">
    <div class="rs-title">Service Area Selector</div>
    <div class="rs-info" id="rsInfo">Click the map to set a center point.</div>
    <label class="rs-slider-wrap">
      Radius: <output id="rsRadiusOut">5</output> km
      <input type="range" id="rsRadius" min="1" max="50" value="5">
    </label>
  </div>
  <div class="rs-map" id="rsMap"></div>
</div>*{box-sizing:border-box;margin:0;padding:0}
body{font-family:system-ui,-apple-system,sans-serif}
.rs-wrap{height:100vh;min-height:480px;display:flex;flex-direction:column}
.rs-bar{padding:12px 16px;background:#fff;border-bottom:1px solid #e2e8f0;display:flex;align-items:center;gap:18px;flex-wrap:wrap}
.rs-title{font-size:13px;font-weight:800;color:#0f172a}
.rs-info{font-size:12px;color:#6366f1;font-weight:700;flex:1;min-width:180px}
.rs-slider-wrap{display:flex;align-items:center;gap:8px;font-size:12px;font-weight:600;color:#334155}
.rs-slider-wrap output{font-weight:800;color:#6366f1;min-width:20px}
.rs-slider-wrap input{width:130px;accent-color:#6366f1}
.rs-map{flex:1}
.rs-pin-icon{background:#6366f1;width:12px;height:12px;border-radius:50%;border:2px solid #fff;box-shadow:0 1px 4px rgba(0,0,0,.5)}var map = L.map('rsMap').setView([37.775, -122.42], 11);
L.tileLayer('https://server.arcgisonline.com/ArcGIS/rest/services/World_Street_Map/MapServer/tile/{z}/{y}/{x}', {
attribution: 'Tiles © Esri',
maxZoom: 19,
}).addTo(map);
var centerMarker = null;
var circle = null;
var radiusKm = 5;
var radiusInput = document.getElementById('rsRadius');
var radiusOut = document.getElementById('rsRadiusOut');
var infoEl = document.getElementById('rsInfo');
var pinIcon = L.divIcon({ className: 'rs-pin-icon', iconSize: [12, 12] });
function formatArea(km) {
var areaKm2 = Math.PI * km * km;
return areaKm2 >= 100 ? Math.round(areaKm2).toLocaleString('en-US') : areaKm2.toFixed(1);
}
function updateInfo(latlng) {
infoEl.textContent = latlng
? radiusKm + ' km radius \u2014 covers about ' + formatArea(radiusKm) + ' km\u00b2. Drag the pin or click elsewhere to move it.'
: 'Click the map to set a center point.';
}
function placeOrMove(latlng) {
if (!circle) {
// L.circle takes a radius in METERS regardless of the map's zoom level --
// unlike a plain SVG circle, its on-screen size is computed from real
// geographic distance, so it stays the correct physical size as you zoom.
circle = L.circle(latlng, { radius: radiusKm * 1000, color: '#6366f1', weight: 2, fillOpacity: 0.15 }).addTo(map);
centerMarker = L.marker(latlng, { icon: pinIcon, draggable: true }).addTo(map);
centerMarker.on('drag', function (e) { circle.setLatLng(e.target.getLatLng()); updateInfo(e.target.getLatLng()); });
} else {
circle.setLatLng(latlng);
centerMarker.setLatLng(latlng);
}
updateInfo(latlng);
}
map.on('click', function (e) { placeOrMove(e.latlng); });
radiusInput.addEventListener('input', function () {
radiusKm = Number(radiusInput.value);
radiusOut.textContent = radiusKm;
if (circle) {
circle.setRadius(radiusKm * 1000);
updateInfo(circle.getLatLng());
}
});Step by step
How to Use
- 1Add the Leaflet CDNLoad leaflet.css and leaflet.js before the snippet's JS runs.
- 2Paste HTML, CSS, and JSAn empty map renders with a radius slider above it.
- 3Click anywhere on the mapA pin and a circle appear centered on that point.
- 4Drag the pinThe circle follows in real time as you move it.
- 5Adjust the radius sliderThe circle resizes to the new true geographic distance.
- 6Zoom in or outThe circle stays the correct real-world size on screen.
Real-world uses
Common Use Cases
Got questions?
Frequently Asked Questions
L.circle is created with its radius specified in real-world meters, not screen pixels. Leaflet recalculates the circle's on-screen pixel size from that real distance every time the map's zoom level changes, so a circle representing 5 kilometers on the ground always represents 5 kilometers regardless of how zoomed in or out the view currently is — unlike an SVG circle drawn with a fixed pixel radius, which would visually represent a different real distance at every zoom level.
The marker's drag event (which fires continuously throughout the drag gesture, not just once on release) calls circle.setLatLng() with the marker's current position on every single movement. Using dragend instead would only update the circle once the drag finishes, producing a pin that visibly detaches from its circle mid-drag and then snaps them back together at the end.
The handler calls circle.setRadius() on the already-existing circle object, which updates its geometry in place. Removing and re-adding a new circle on every slider input event (which can fire dozens of times during one drag) would be wasteful and could introduce a visible flicker or momentarily lose the circle's current center position.
The area text is computed with the standard circle-area formula (pi times radius squared) applied directly to the same radiusKm variable that also drives the circle's actual radius. Because both the visual circle and the text read from one shared value, there is no way for the displayed area to describe a different radius than what is actually drawn on the map.
Keep the center coordinate and radius in component state, initialize the Leaflet map and circle once in a mount effect, and update the circle's position/radius from state changes via setLatLng/setRadius rather than recreating the circle object on every render. Read the final { lat, lng, radiusKm } values from state whenever your app needs to submit or query against the selected area.