

Learn Coding Visually
Learn to code with interactive, live-preview playgrounds — HTML, CSS, JavaScript, React & more.
 HTML Playground42 lessons · Click-based · Live preview
 CSS PlaygroundLearn CSS with a live editor
 JavaScript Playground60 lessons · DOM · Async · Canvas
 React PlaygroundLearn React with a live code editor
 GSAP PlaygroundLearn GSAP animation interactively
 SVG Playground44 lessons · shapes · paths · animation
 SCSS Playground45 lessons · Sass modules · tokens
 Tailwind PlaygroundLearn Tailwind CSS with a live editor
 Bootstrap 5 Playground50 lessons · live preview
Snap.svg Animated Line Chart — Self-Drawing Chart Reveal Snippet
Snap.svg Animated Line Chart · Charts · Plain HTML, CSS & JS · Live preview
What's included
Features
About this UI Snippet
Snap.svg Animated Line Chart — The Dash-Offset Draw Reveal, Explained
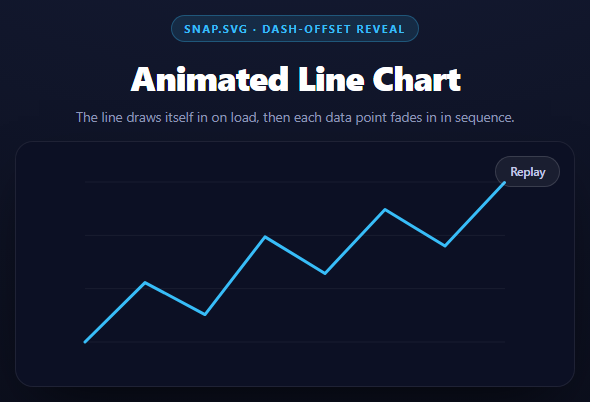
The "line draws itself in" effect looks like it must involve some kind of clipping mask or path-length trickery unique to animation libraries, but it's actually a clever repurposing of two ordinary SVG stroke properties: stroke-dasharray and stroke-dashoffset.
Dash arrays are just a repeating on/off pattern
stroke-dasharray normally creates dashed lines by telling the renderer to alternate a fixed length of visible stroke with a fixed length of gap, repeating along the path. The reveal trick sets the dash length to the exact total length of the path:
var len = linePath.node.getTotalLength();
linePath.attr({ strokeDasharray: len, strokeDashoffset: len });
With a dash-and-gap length equal to the whole path, there is effectively only one dash and one gap, each as long as the entire line. getTotalLength() is a native SVG DOM method (called on linePath.node, the raw DOM element Snap wraps) that measures the path's actual on-screen length regardless of how many points or curves it contains.
Offsetting the dash out of view
stroke-dashoffset shifts *where along the path* the dash pattern begins. Setting it equal to the path's own length shifts the single visible dash entirely past the end of the path — so what's actually rendered is 100% gap, and the line appears completely invisible, even though it's technically already drawn.
Animating the reveal
linePath.animate({ strokeDashoffset: 0 }, 1100, mina.easeinout, callback);
As stroke-dashoffset eases from len down to 0, the single dash's starting position slides backward along the path, which has the visual effect of the visible portion growing from the path's start point toward its end — exactly like a pen drawing the line. Snap.svg's .animate() handles interpolating the numeric attribute over the given duration and calls the fourth argument as a completion callback once the tween finishes.
Staggering the data points after the line
The completion callback, revealDots(points), only runs once strokeDashoffset finishes animating to 0 — so the circles never appear before the line has visually "reached" them. Each dot's own .animate({ opacity: 1 }, ...) call is additionally delayed with a plain setTimeout scaled by its index (i * 90ms), producing a left-to-right cascade rather than all eight dots popping in simultaneously.
Why s.clear() at the top of draw()
Because draw() doubles as the replay handler, it needs to remove the previous line, gridlines, and dots before rebuilding them — s.clear() empties the whole <svg> root so each replay starts from a truly blank canvas rather than stacking a second line and a second set of dots on top of the first.
Build with AI
Build, Understand, Optimize, and Extend It With AI
The dash-offset reveal is a classic SVG trick worth fully internalizing, so start there. Paste the code into an AI assistant like Claude and ask it to walk through, step by step, why setting stroke-dasharray and stroke-dashoffset to the SAME value (the path's total length) produces an invisible line, and why animating dashoffset down to zero specifically reveals the line from its start point rather than its end or its middle. Then ask what would need to change to reveal the line from right to left instead, or to reveal it from the center outward in both directions. To extend it: add a second data series with its own color and dash-reveal timing, add a value tooltip that appears on hover over each dot, animate the y-axis gridlines in with a similar staggered fade, or make the chart responsive to a live-updating data source with a smooth path transition between old and new data.
Prompt to recreate it
Copy this into your AI assistant of choice to build the effect from scratch, or as a jumping-off point for your own variant:
Build a self-drawing animated line chart using Snap.svg (v0.5.1, from a CDN) in plain HTML, CSS, and JavaScript.

Requirements:
- An inline SVG chart area with a data array of numeric values, and a toPoints() function that maps those values into {x, y} pixel coordinates scaled to fit the SVG's viewBox, accounting for a padding margin.
- Draw a few faint horizontal gridlines first, underneath everything else.
- Build the line as a single Snap.svg path (s.path(...)) from an "M x,y L x,y L x,y ..." string generated from the mapped points, styled with a colored stroke, no fill, and rounded line caps/joins.
- Implement the classic SVG draw-in reveal: measure the path's real length with linePath.node.getTotalLength(), set both stroke-dasharray and stroke-dashoffset to that length (making the line start fully invisible), then animate stroke-dashoffset down to 0 over roughly 1 second using Snap's .animate() with a mina easing function.
- Pass a completion callback to that animate() call that reveals circular data-point markers at each mapped coordinate ONLY after the line has finished drawing \u2014 fade each circle's opacity in via its own short animate() call, staggered with an increasing setTimeout delay per point (e.g. index * 90ms) so they cascade in left to right rather than appearing all at once.
- Wrap the whole build sequence in a single function (e.g. draw()) that starts with s.clear() to empty the SVG, and wire a "Replay" button to call that same function again so the entire animation can be re-triggered.
- Style it as a dark card containing the chart with a small replay button in the corner.
Want to tighten it up first? Run this prompt through the AI Prompt Studio to score it across 8 quality dimensions, catch anti-patterns, and tune the wording for Claude, ChatGPT, or Gemini before you paste it in.
Source Code
<div class="salc-stage">
  <div class="salc-head">
    <span class="salc-tag">Snap.svg · dash-offset reveal</span>
    <h2>Animated Line Chart</h2>
    <p>The line draws itself in on load, then each data point fades in in sequence.</p>
  </div>
  <div class="salc-card">
    <svg id="salcSvg" viewBox="0 0 480 220" width="100%" height="220"></svg>
    <button class="salc-replay" id="salcReplay">Replay</button>
  </div>
</div>*{box-sizing:border-box;margin:0;padding:0}
body{font-family:system-ui,-apple-system,sans-serif;background:radial-gradient(120% 100% at 50% 0%,#161d38,#080a14);color:#fff;min-height:100vh;display:flex;align-items:center;justify-content:center;padding:24px}
.salc-stage{width:min(560px,94vw);display:flex;flex-direction:column;align-items:center;gap:16px}
.salc-head{text-align:center}
.salc-tag{display:inline-block;font-size:11px;font-weight:700;letter-spacing:.14em;text-transform:uppercase;color:#38bdf8;background:rgba(56,189,248,.12);border:1px solid rgba(56,189,248,.3);padding:5px 12px;border-radius:99px;margin-bottom:12px}
.salc-head h2{font-size:clamp(24px,5vw,34px);font-weight:800;letter-spacing:-.02em}
.salc-head p{font-size:13.5px;color:#8e97b8;margin-top:7px}
.salc-card{position:relative;width:100%;border-radius:18px;overflow:hidden;background:#0c1024;border:1px solid rgba(255,255,255,.08);box-shadow:0 24px 60px -24px rgba(0,0,0,.8);padding:10px 0}
.salc-replay{position:absolute;top:14px;right:14px;padding:7px 14px;border-radius:99px;border:1px solid rgba(255,255,255,.14);background:rgba(255,255,255,.06);color:#c3cbe8;font:600 11.5px system-ui;cursor:pointer}
.salc-replay:hover{background:rgba(255,255,255,.12);color:#fff}var s = Snap('#salcSvg');
var W = 480, H = 220, PAD = 30;
var data = [22, 48, 34, 68, 52, 80, 64, 92];
function toPoints(values) {
var stepX = (W - PAD * 2) / (values.length - 1);
var max = Math.max.apply(null, values);
var min = Math.min.apply(null, values);
return values.map(function (v, i) {
var x = PAD + i * stepX;
var y = H - PAD - ((v - min) / (max - min)) * (H - PAD * 2);
return { x: x, y: y };
});
}
function buildPathString(points) {
return points.map(function (p, i) {
return (i === 0 ? 'M' : 'L') + p.x + ',' + p.y;
}).join(' ');
}
function draw() {
s.clear();
var points = toPoints(data);
// Faint horizontal gridlines drawn first, underneath everything else.
for (var g = 0; g <= 3; g++) {
var gy = PAD + (g * (H - PAD * 2)) / 3;
s.line(PAD, gy, W - PAD, gy).attr({ stroke: 'rgba(255,255,255,0.06)', strokeWidth: 1 });
}
var linePath = s.path(buildPathString(points)).attr({
stroke: '#38bdf8',
strokeWidth: 3,
fill: 'none',
strokeLinecap: 'round',
strokeLinejoin: 'round'
});
// getTotalLength / stroke-dasharray / stroke-dashoffset is the classic
// SVG "line draw" reveal: a dash pattern exactly as long as the path,
// offset by that same length so nothing is visible, then animated back
// to offset 0 so the visible portion grows from start to end.
var len = linePath.node.getTotalLength();
linePath.attr({ strokeDasharray: len, strokeDashoffset: len });
linePath.animate({ strokeDashoffset: 0 }, 1100, mina.easeinout, function () {
revealDots(points);
});
s.dots = points;
}
function revealDots(points) {
points.forEach(function (p, i) {
var dot = s.circle(p.x, p.y, 5).attr({
fill: '#0c1024',
stroke: '#38bdf8',
strokeWidth: 2,
opacity: 0
});
// Each dot fades in staggered AFTER the line finishes, so the eye
// reads the sequence as "line draws, then points land" rather than
// everything appearing simultaneously.
dot.animate({ opacity: 1 }, 260, mina.easeout, null);
(function (d, delayMs) {
setTimeout(function () {
d.animate({ opacity: 1, r: 5 }, 280, mina.backout || mina.easeout);
}, delayMs);
})(dot, i * 90);
});
}
document.getElementById('salcReplay').addEventListener('click', draw);
draw();Step by step
How to Use
- 1Add the Snap.svg CDNInclude snap.svg-min.js from the CDN panel — it attaches a global Snap function.
- 2Paste HTML, CSS, and JSThe chart draws itself in automatically as soon as the script runs.
- 3Watch the line revealstroke-dashoffset eases from the path\u2019s length to 0 over 1.1 seconds.
- 4Watch the points cascade inCircles fade in left to right only after the line finishes drawing.
- 5Click Replaydraw() clears the SVG and re-runs the whole reveal sequence from scratch.
- 6Swap in your own dataChange the data array — toPoints() rescales it to fit the chart automatically.
Real-world uses
Common Use Cases
Got questions?
Frequently Asked Questions
It sets stroke-dasharray to the path\u2019s exact total length (from getTotalLength()), which makes the dash pattern effectively one dash and one gap the length of the whole line. Setting stroke-dashoffset to that same length shifts the visible dash entirely off the path, so it starts invisible. Animating dashoffset down to 0 slides the visible portion in from the start, reading as a line being drawn.
getTotalLength() is a native SVG DOM method that returns the path\u2019s actual rendered length, accounting for however many points or curve segments it has. Using a fixed guess would either leave a visible dash gap if too short, or not fully reveal the line if too long.
revealDots() is passed as the completion callback to the line\u2019s Snap.animate() call, so it only runs once stroke-dashoffset has finished easing to 0 \u2014 keeping the visual sequence as "line draws in, then points land" rather than everything appearing at once.
Each dot\u2019s animate() call is wrapped in a setTimeout whose delay is the dot\u2019s index multiplied by a fixed interval (90ms), so dot 0 starts immediately, dot 1 after 90ms, dot 2 after 180ms, and so on \u2014 producing a left-to-right cascade.
draw() is reused as the replay handler. Without clearing the SVG root first, each replay would add a second line, second gridlines, and second set of dots on top of the previous ones instead of starting from a blank chart.
Build the path string with C (cubic Bezier) commands instead of L, but the dash-offset reveal technique works identically \u2014 getTotalLength() and stroke-dashoffset operate on the rendered path length regardless of whether it is made of lines or curves.