Learn Coding Visually
Learn to code with interactive, live-preview playgrounds — HTML, CSS, JavaScript, React & more.
 HTML Playground42 lessons · Click-based · Live preview
 CSS PlaygroundLearn CSS with a live editor
 JavaScript Playground60 lessons · DOM · Async · Canvas
 React PlaygroundLearn React with a live code editor
 GSAP PlaygroundLearn GSAP animation interactively
 SVG Playground44 lessons · shapes · paths · animation
 SCSS Playground45 lessons · Sass modules · tokens
 Tailwind PlaygroundLearn Tailwind CSS with a live editor
 Bootstrap 5 Playground50 lessons · live preview
Rough.js Hand-Drawn Bar Chart — Sketchy Canvas Chart Snippet
Rough.js Hand-Drawn Bar Chart · Charts · Plain HTML, CSS & JS · Live preview
What's included
Features
About this UI Snippet
Rough.js Hand-Drawn Bar Chart — Animating a One-Shot Drawing Library
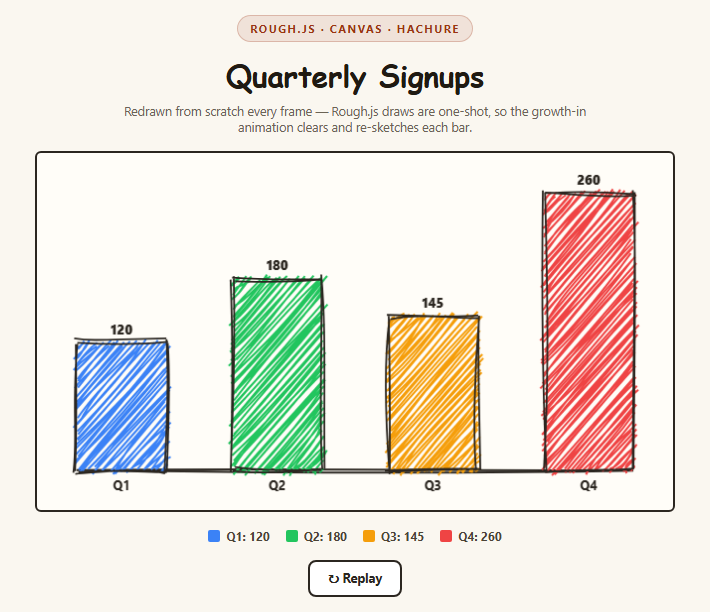
Most charting is either DOM-based (SVG rectangles you can resize with a CSS transition) or canvas-based with your own persistent drawing state. Rough.js is neither. It's a one-shot procedural sketch renderer: every call to rc.rectangle() or rc.line() immediately draws hand-jittered strokes onto the canvas and then forgets everything about that shape. There's no retained rectangle object you can later ask to "grow taller" — the moment you want the bar at a different height, you have to draw an entirely new sketch from scratch.
Why that forces a clear-and-redraw animation loop
js
function drawFrame(progress) {
  ctx.clearRect(0, 0, W, H);
  // ...draw axis and all bars scaled to progress...
}
Because Rough.js has nothing to transition, animating "bars growing in" means running a normal requestAnimationFrame loop where every single frame clears the whole canvas and re-sketches everything from zero, just with each bar's height multiplied by a progress fraction between 0 and 1. This is the opposite of how you'd animate an SVG bar (just tween a height attribute) or a DOM bar (a CSS transition) — there, the shape persists and only one property changes. Here, the *entire drawing* is disposable and regenerated on each tick.
It also means each frame's rectangle looks like an independently hand-drawn sketch — because it genuinely is one. Rough.js re-randomizes its jitter on every draw call unless you pass a fixed seed, so a bar's "hand-drawn" wobble is technically slightly different in every single animation frame, which if anything makes the growth feel more organic rather than a rigid tween.
hachure fill, and why it's not a plain fill color
fillStyle: 'hachure' tells Rough.js to fill the rectangle with a field of roughly parallel diagonal lines (the classic architectural-sketch cross-hatch look) rather than a flat color. hachureGap: 5 controls the spacing between those lines, and fillWeight: 2 controls their stroke thickness. This is fundamentally different from ctx.fillStyle = color; ctx.fillRect(...) — Rough.js is drawing dozens of individual jittered line segments per bar, which is exactly what gives it the whiteboard-marker texture instead of a clean vector fill. fillStyle: 'cross-hatch' (hachure lines in two directions) is available for a denser, scribbled look if you want more visual weight per bar.
roughness as the "how sketchy" knob
roughness: 2 (Rough.js's default is 1) controls how far each line segment's endpoints and midpoints are randomly displaced from the mathematically "correct" position. Higher values look more hand-drawn and unstable; values near 0 approach a clean geometric shape. Turning it up on the bars but keeping the axis line closer to default is a deliberate way to make the data itself feel loosely sketched while the chart's structural framing stays legible.
Reusing it
Feed real data into the data array and the rest is untouched — bar count, colors, and value labels all derive from it. For a static (non-animating) chart, just call drawFrame(1) once instead of running animateIn(). Pair the hachure technique with the sketchy annotation highlight snippet, which uses the same rough.canvas() setup but for marking up real DOM text instead of drawing chart geometry.
Build with AI
Build, Understand, Optimize, and Extend It With AI
The core concept worth understanding here is that Rough.js is a one-shot renderer with no retained shapes, which is unusual compared to most drawing APIs. Ask an AI assistant like Claude to explain precisely why that forces a clear-and-redraw animation loop instead of a property tween, and what the tradeoff is versus animating an equivalent SVG bar chart with CSS transitions. Then ask what a fixed seed option would change about the growth animation (each frame would use identical jitter instead of independently re-randomizing). Good extensions: add a horizontal grid of sketched gridlines behind the bars, support negative values with bars growing downward from a zero line, add hover tooltips showing exact values, or let each bar animate in staggered by index rather than all growing simultaneously. Pair with the sketchy annotation highlight snippet to see the same rough.canvas() API used for text markup instead of chart geometry.
Prompt to recreate it
Copy this into your AI assistant of choice to build the effect from scratch, or as a jumping-off point for your own variant:
Build a hand-drawn "whiteboard style" animated bar chart using Rough.js (v4.6, from a CDN) in plain HTML, CSS, and JavaScript, rendered on a <canvas>.

Requirements:
- Define a JS array of 4 data points (label, numeric value, hex color), and compute bar width/height/positions from canvas dimensions and the max value in the data.
- Create the Rough.js canvas renderer with rough.canvas(canvasEl). For each bar, call rc.rectangle(x, y, width, height, { fill: color, fillStyle: 'hachure', hachureGap: 5, fillWeight: 2, roughness: 2, stroke: '#2b2620', strokeWidth: 1.8 }) — the hachure fill and roughness value are essential for the hand-sketched whiteboard-marker look, not a flat vector fill.
- Implement the bar growth-in animation as a requestAnimationFrame loop that, on every tick, calls ctx.clearRect() over the whole canvas and then completely redraws the axis line and every bar scaled by an eased progress value from 0 to 1 — explicitly because Rough.js draw calls are one-shot and immediate (there is no persistent shape object to resize or transition), so the ONLY way to animate is to regenerate the entire sketch from scratch on every single frame.
- Use a cubic ease-out curve for the progress value so the growth decelerates naturally rather than stopping abruptly, and use requestAnimationFrame timestamps (not setInterval) to drive the loop over roughly 900ms.
- Draw axis labels (category names) and, once a bar is nearly fully grown, its numeric value, using plain ctx.fillText() canvas text layered on top of the sketchy rectangles — text should stay crisp, never sketch-rendered.
- Add a "Replay" button that re-runs the growth animation from progress 0, and a small color-coded legend below the chart summarizing each bar's label and value.
- Style the page as a light "paper" background with a bold-bordered canvas panel, evoking a whiteboard or notebook sketch aesthetic. Keep all JavaScript in var/function style, no ES modules.
Want to tighten it up first? Run this prompt through the AI Prompt Studio to score it across 8 quality dimensions, catch anti-patterns, and tune the wording for Claude, ChatGPT, or Gemini before you paste it in.
Source Code
<div class="rhc-stage">
  <div class="rhc-head">
    <span class="rhc-tag">Rough.js · canvas · hachure</span>
    <h2>Quarterly Signups</h2>
    <p>Redrawn from scratch every frame — Rough.js draws are one-shot, so the growth-in animation clears and re-sketches each bar.</p>
  </div>
  <canvas id="rhcCanvas" width="640" height="360"></canvas>
  <div class="rhc-legend" id="rhcLegend"></div>
  <button class="rhc-replay" id="rhcReplay">↻ Replay</button>
</div>*{box-sizing:border-box;margin:0;padding:0}
body{font-family:system-ui,-apple-system,sans-serif;background:#faf7f0;color:#2b2620;min-height:100vh;display:flex;align-items:center;justify-content:center;padding:24px}
.rhc-stage{width:min(680px,96vw);display:flex;flex-direction:column;align-items:center;gap:16px}
.rhc-head{text-align:center}
.rhc-tag{display:inline-block;font-size:11px;font-weight:700;letter-spacing:.14em;text-transform:uppercase;color:#9a3412;background:rgba(154,52,18,.1);border:1px solid rgba(154,52,18,.25);padding:5px 12px;border-radius:99px;margin-bottom:12px}
.rhc-head h2{font-family:'Comic Sans MS',ui-rounded,system-ui;font-size:clamp(22px,5vw,30px);font-weight:800;letter-spacing:-.01em;color:#1f1a12}
.rhc-head p{font-size:12.5px;color:#6b6355;margin-top:7px;max-width:520px;margin-inline:auto}
#rhcCanvas{width:100%;max-width:640px;height:auto;background:#fffdf8;border:2px solid #2b2620;border-radius:6px}
.rhc-legend{display:flex;gap:16px;flex-wrap:wrap;justify-content:center;font-size:12px;font-weight:700;color:#4a4335}
.rhc-legend span{display:inline-flex;align-items:center;gap:6px}
.rhc-legend i{width:12px;height:12px;border-radius:2px;display:inline-block}
.rhc-replay{padding:8px 18px;border-radius:8px;border:2px solid #2b2620;background:#fff;color:#2b2620;font:700 12.5px system-ui;cursor:pointer;transition:background .15s}
.rhc-replay:hover{background:#f3ead8}var data = [
{ label: 'Q1', value: 120, color: '#3b82f6' },
{ label: 'Q2', value: 180, color: '#22c55e' },
{ label: 'Q3', value: 145, color: '#f59e0b' },
{ label: 'Q4', value: 260, color: '#ef4444' },
];
var canvas = document.getElementById('rhcCanvas');
var ctx = canvas.getContext('2d');
var rc = rough.canvas(canvas);
var W = canvas.width, H = canvas.height;
var padding = 40;
var chartH = H - padding * 2;
var maxVal = Math.max.apply(null, data.map(function (d) { return d.value; }));
var barW = 90;
var gap = (W - padding * 2 - barW * data.length) / (data.length - 1);
function drawFrame(progress) {
ctx.clearRect(0, 0, W, H);
// Baseline axis, sketched fresh every frame like everything else.
rc.line(padding, H - padding, W - padding, H - padding, { stroke: '#2b2620', strokeWidth: 2, roughness: 1.6 });
data.forEach(function (d, i) {
var fullH = (d.value / maxVal) * chartH;
var h = fullH * progress;
var x = padding + i * (barW + gap);
var y = H - padding - h;
rc.rectangle(x, y, barW, h, {
fill: d.color,
fillStyle: 'hachure',
hachureGap: 5,
fillWeight: 2,
roughness: 2,
stroke: '#2b2620',
strokeWidth: 1.8,
});
ctx.font = '700 13px system-ui, sans-serif';
ctx.fillStyle = '#2b2620';
ctx.textAlign = 'center';
ctx.fillText(d.label, x + barW / 2, H - padding + 20);
if (progress > 0.85) {
ctx.font = '800 13px system-ui, sans-serif';
ctx.fillText(d.value, x + barW / 2, y - 8);
}
});
}
function animateIn() {
var start = null;
var duration = 900;
function step(ts) {
if (!start) start = ts;
var elapsed = ts - start;
var t = Math.min(1, elapsed / duration);
var eased = 1 - Math.pow(1 - t, 3);
drawFrame(eased);
if (t < 1) requestAnimationFrame(step);
}
requestAnimationFrame(step);
}
var legend = document.getElementById('rhcLegend');
data.forEach(function (d) {
var el = document.createElement('span');
el.innerHTML = '<i style="background:' + d.color + '"></i>' + d.label + ': ' + d.value;
legend.appendChild(el);
});
document.getElementById('rhcReplay').addEventListener('click', animateIn);
animateIn();Step by step
How to Use
- 1Add the Rough.js CDNInclude rough.umd.js from the CDN panel — a single script tag exposing the rough global.
- 2Paste HTML, CSS, and JSA 4-bar canvas chart renders and animates its bars growing in on load.
- 3Watch the growth-in animationEvery frame clears the canvas and redraws all bars scaled to the current progress fraction.
- 4Click ReplayRe-runs the same requestAnimationFrame loop from progress 0.
- 5Swap in real dataEdit the data array — labels, values, and colors — no other code needs to change.
- 6Try a static chartCall drawFrame(1) once instead of animateIn() if you don't want the growth animation.
Real-world uses
Common Use Cases
Got questions?
Frequently Asked Questions
Rough.js has no retained shape objects — rc.rectangle() immediately draws jittered strokes onto the canvas and returns nothing you can later mutate. There is no "this rectangle, but taller" operation, so animating growth requires calling clearRect() and re-running every draw call each frame with the new height, which is fundamentally different from SVG or DOM animation where the element persists and only one attribute changes.
A normal ctx.fillRect() with a solid fillStyle color paints a flat rectangle. Rough.js's hachure fill instead draws many individual roughly-parallel, jittered line segments across the shape's interior, spaced by hachureGap and stroked at hachureWeight — visually resembling pencil or marker cross-hatching, which is the core of the "hand-drawn" look.
Not meaningfully at chart scale — roughness only adds a small amount of extra math (random displacement calculations) per line segment, and a 4-bar chart involves a handful of segments per frame. It would only become a performance concern with hundreds of shapes redrawn at 60fps, which is well beyond a typical chart.
Rough.js re-randomizes its jitter on every single draw call unless you explicitly pass a fixed seed option. Since the growth animation calls rc.rectangle() fresh on every requestAnimationFrame tick, each frame is technically an independently hand-sketched rectangle, which if anything reinforces the organic, hand-drawn feel rather than looking like a rigid tween.
Pass a fixed seed value in the options object, e.g. { seed: 42 }, and Rough.js will use that seed for its pseudo-random jitter instead of a new random one each call — useful if you want a chart that looks identical on every reload, at the cost of the subtle per-frame variation this snippet relies on for the growth animation.
Yes — cross-hatch draws hachure lines in two intersecting directions instead of one, producing a denser, more scribbled fill. It's a drop-in replacement for the fillStyle value with no other option changes required, and reads as more visually "busy" per bar.