Quadtree Spatial Partitioning Visualizer
Sliding Window Two-Pointer Visualizer (Longest Substring Without Repeats)
Flex Grow and Shrink Space Distribution Visualizer
Promise.all vs allSettled vs race vs any Visualizer
Huffman Coding Tree Visualizer
Levenshtein Edit Distance Dynamic Programming Visualizer
Learn Coding Visually
Learn to code with interactive, live-preview playgrounds — HTML, CSS, JavaScript, React & more.
 HTML Playground42 lessons · Click-based · Live preview
 CSS PlaygroundLearn CSS with a live editor
 JavaScript Playground60 lessons · DOM · Async · Canvas
 React PlaygroundLearn React with a live code editor
 GSAP PlaygroundLearn GSAP animation interactively
 SVG Playground44 lessons · shapes · paths · animation
 SCSS Playground45 lessons · Sass modules · tokens
 Tailwind PlaygroundLearn Tailwind CSS with a live editor
 Bootstrap 5 Playground50 lessons · live preview
Quadtree Spatial Partitioning Visualizer — Free Interactive Canvas Demo
Quadtree Spatial Partitioning Visualizer · Visualizers · Plain HTML, CSS & JS · Live preview
What's included
Features
About this UI Snippet
Quadtrees — Skipping Most of the Work in Spatial Queries
Many interactive programs keep asking the same question: which things are near this point? Games check collisions, maps find markers in the visible area, and drawing tools find shapes under the cursor. Checking every object each time is O(n) per query, and doing that for every object gives O(n²). A quadtree organises points by position so a query can skip whole regions at once.
How a quadtree is built
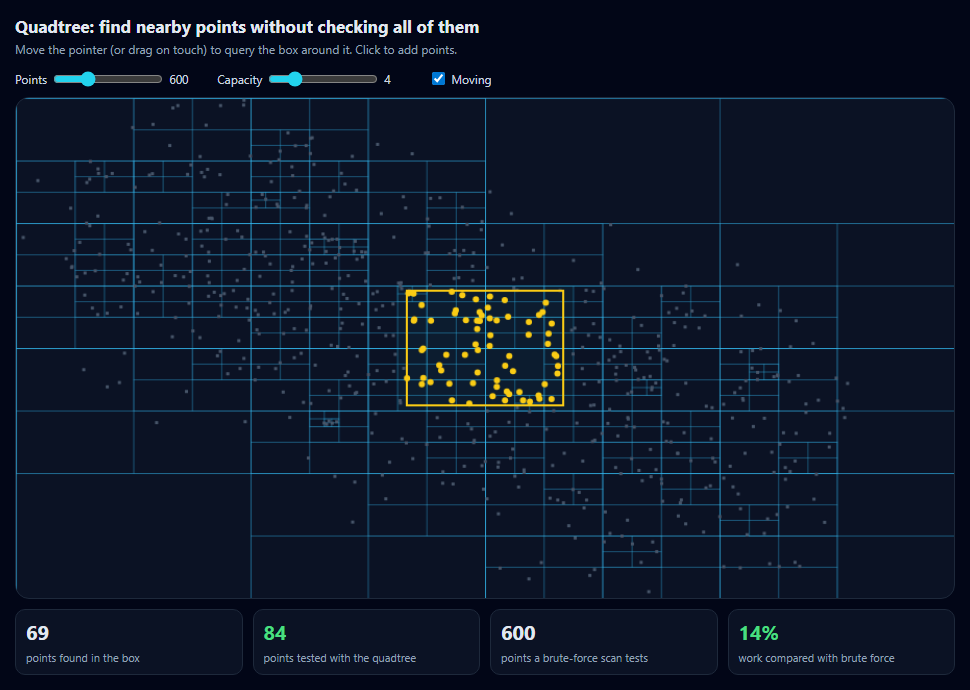
The root node covers the whole canvas. Each node holds up to a fixed number of points — the capacity. When one more point arrives, the node splits into four equal quadrants and pushes its points down into them. Dense areas therefore end up with many small cells, and empty areas stay as large cells. A depth limit stops endless splitting when many points share almost the same position.
How a query works
To find points inside a box, start at the root. If a node's rectangle doesn't overlap the box, skip it and everything below it. Otherwise test its own points and recurse into its children. The cyan-tinted cells are the leaves the query actually visited; everything else was skipped without looking at a single point.
Measuring the saving
The counters compare the number of points the quadtree tested with the number a brute-force scan would test. With clustered data and a small box, the quadtree typically tests a small fraction.
Capacity is a trade-off
A capacity of 1 creates a very deep tree with many nodes to visit; a large capacity makes each leaf a small brute-force scan. Try the slider and watch both the cell pattern and the percentage change.
Rebuilt every frame
The points move, so the tree is rebuilt on every animation frame. For thousands of points that is fast, and it avoids the complexity of moving points between nodes.
Build with AI
Build, Understand, Optimize, and Extend It With AI
Paste this snippet into an AI assistant like Claude and ask it to explain why skipping non-overlapping nodes is safe. Ask it to add a circular radius query, a k-nearest-neighbours search, collision detection between points using the tree, or a uniform grid mode to compare against the quadtree. It can also help you measure when rebuilding every frame stops being cheap.
Prompt to recreate it
Copy this into your AI assistant of choice to build the effect from scratch, or as a jumping-off point for your own variant:
Build an interactive quadtree visualizer on an HTML canvas in plain HTML, CSS and JavaScript on a dark theme.

Requirements:
- Generate several hundred points in clusters, moving and bouncing off the edges (with a toggle to pause movement, off by default for reduced motion).
- Rebuild a quadtree every frame: each node covers a rectangle and holds up to a configurable capacity of points, splitting into four quadrants and redistributing its points when full, with a maximum depth.
- Draw every node's rectangle faintly and the points as small dots.
- Query a rectangular box that follows the pointer: skip nodes that don't overlap it, test points in the nodes that do, and highlight found points and the visited leaf cells.
- Show counters for points found, points tested by the quadtree, points a brute-force scan would test, and the percentage of work compared with brute force.
- Sliders for point count (50–2000) and capacity (1–16), and clicking adds a small cluster of points.
Want to tighten it up first? Run this prompt through the AI Prompt Studio to score it across 8 quality dimensions, catch anti-patterns, and tune the wording for Claude, ChatGPT, or Gemini before you paste it in.
Source Code
<div class="qt">
  <div class="qt-top">
    <div>
      <h2>Quadtree: find nearby points without checking all of them</h2>
      <p>Move the pointer (or drag on touch) to query the box around it. Click to add points.</p>
    </div>
    <div class="qt-ctrl">
      <label>Points <input type="range" id="qtN" min="50" max="2000" step="50" value="600"><output id="qtNOut"></output></label>
      <label>Capacity <input type="range" id="qtCap" min="1" max="16" value="4"><output id="qtCapOut"></output></label>
      <label><input type="checkbox" id="qtMove" checked> Moving</label>
    </div>
  </div>
  <canvas id="qtCanvas" width="900" height="480" aria-label="Quadtree of moving points"></canvas>
  <div class="qt-stats" id="qtStats" aria-live="off"></div>
</div>*{box-sizing:border-box;margin:0;padding:0}
body{font-family:system-ui,-apple-system,sans-serif;background:#020617;color:#e2e8f0;min-height:100vh;display:flex;align-items:center;justify-content:center;padding:20px}
.qt{width:100%;max-width:940px}
.qt-top{display:flex;justify-content:space-between;align-items:flex-end;gap:14px;flex-wrap:wrap;margin-bottom:10px}
.qt h2{font-size:17px}
.qt-top p{font-size:12px;color:#94a3b8;margin-top:4px}
.qt-ctrl{display:flex;gap:14px;flex-wrap:wrap;font-size:12px;color:#cbd5e1}
.qt-ctrl label{display:flex;align-items:center;gap:6px}
.qt-ctrl input[type=range]{width:110px;accent-color:#22d3ee}
.qt-ctrl output{width:34px;font-variant-numeric:tabular-nums}
#qtCanvas{width:100%;height:auto;display:block;background:#0b1224;border:1px solid #1e293b;border-radius:14px;touch-action:none;cursor:crosshair}
.qt-stats{display:grid;grid-template-columns:repeat(4,1fr);gap:10px;margin-top:10px}
@media (max-width:640px){.qt-stats{grid-template-columns:repeat(2,1fr)}}
.qt-stat{background:#0b1224;border:1px solid #1e293b;border-radius:10px;padding:8px 10px}
.qt-stat b{display:block;font-size:20px;font-variant-numeric:tabular-nums}
.qt-stat small{font-size:11px;color:#94a3b8}
.qt-stat.good b{color:#4ade80}var canvas = document.getElementById('qtCanvas');
var ctx = canvas.getContext('2d');
var W = canvas.width, H = canvas.height;
var points = [];
var query = { x: W / 2, y: H / 2, w: 150, h: 110 };
var reduce = window.matchMedia('(prefers-reduced-motion: reduce)').matches;
if (reduce) document.getElementById('qtMove').checked = false;
// A quadtree node covers a rectangle. It holds up to CAP points; when one
// more arrives it splits into four equal children and hands points down.
function QT(x, y, w, h, cap, depth) {
this.x = x; this.y = y; this.w = w; this.h = h;
this.cap = cap; this.depth = depth;
this.pts = [];
this.kids = null;
}
QT.prototype.contains = function (p) {
return p.x >= this.x && p.x < this.x + this.w && p.y >= this.y && p.y < this.y + this.h;
};
QT.prototype.insert = function (p) {
if (!this.contains(p)) return false;
if (!this.kids) {
// Depth limit stops endless splitting when many points share a spot.
if (this.pts.length < this.cap || this.depth >= 9) { this.pts.push(p); return true; }
this.split();
}
for (var i = 0; i < 4; i++) if (this.kids[i].insert(p)) return true;
return false;
};
QT.prototype.split = function () {
var hw = this.w / 2, hh = this.h / 2, d = this.depth + 1;
this.kids = [
new QT(this.x, this.y, hw, hh, this.cap, d), new QT(this.x + hw, this.y, hw, hh, this.cap, d),
new QT(this.x, this.y + hh, hw, hh, this.cap, d), new QT(this.x + hw, this.y + hh, hw, hh, this.cap, d),
];
var old = this.pts;
this.pts = [];
old.forEach(function (p) { this.insert(p); }, this);
};
// Query: skip any node whose rectangle doesn't overlap the query box —
// that's where the savings come from. Count every point actually tested.
QT.prototype.query = function (r, out, stats) {
stats.nodes++;
if (r.x > this.x + this.w || r.x + r.w < this.x || r.y > this.y + this.h || r.y + r.h < this.y) return out;
stats.visited.push(this);
for (var i = 0; i < this.pts.length; i++) {
var p = this.pts[i];
stats.checks++;
if (p.x >= r.x && p.x <= r.x + r.w && p.y >= r.y && p.y <= r.y + r.h) out.push(p);
}
if (this.kids) for (var k = 0; k < 4; k++) this.kids[k].query(r, out, stats);
return out;
};
QT.prototype.draw = function () {
ctx.strokeRect(this.x + 0.5, this.y + 0.5, this.w, this.h);
if (this.kids) this.kids.forEach(function (k) { k.draw(); });
};
QT.prototype.count = function () { return 1 + (this.kids ? this.kids.reduce(function (s, k) { return s + k.count(); }, 0) : 0); };
function makePoints(n) {
points = [];
for (var i = 0; i < n; i++) {
// Clustered distribution: real spatial data is rarely uniform.
var cx = [200, 620, 420][i % 3], cy = [150, 320, 240][i % 3];
var a = Math.random() * Math.PI * 2, r = Math.pow(Math.random(), 0.7) * 190;
points.push({ x: Math.min(W - 1, Math.max(0, cx + Math.cos(a) * r)), y: Math.min(H - 1, Math.max(0, cy + Math.sin(a) * r * 0.8)),
vx: (Math.random() - 0.5) * 1.1, vy: (Math.random() - 0.5) * 1.1 });
}
}
function stat(label, value, good) {
return '<div class="qt-stat' + (good ? ' good' : '') + '"><b>' + value + '</b><small>' + label + '</small></div>';
}
var frameCount = 0;
function frame() {
var cap = Number(document.getElementById('qtCap').value);
if (document.getElementById('qtMove').checked) {
points.forEach(function (p) {
p.x += p.vx; p.y += p.vy;
if (p.x < 0 || p.x >= W) { p.vx *= -1; p.x = Math.min(W - 1, Math.max(0, p.x)); }
if (p.y < 0 || p.y >= H) { p.vy *= -1; p.y = Math.min(H - 1, Math.max(0, p.y)); }
});
}
// Rebuilding every frame is simple and, for thousands of points, fast.
var tree = new QT(0, 0, W, H, cap, 0);
points.forEach(function (p) { tree.insert(p); });
var q = { x: query.x - query.w / 2, y: query.y - query.h / 2, w: query.w, h: query.h };
var stats = { nodes: 0, checks: 0, visited: [] };
var found = tree.query(q, [], stats);
ctx.clearRect(0, 0, W, H);
ctx.strokeStyle = 'rgba(56,189,248,.22)';
ctx.lineWidth = 1;
tree.draw();
ctx.fillStyle = 'rgba(34,211,238,.06)';
stats.visited.forEach(function (n) { if (!n.kids) ctx.fillRect(n.x, n.y, n.w, n.h); });
ctx.fillStyle = '#475569';
points.forEach(function (p) { ctx.fillRect(p.x - 1.5, p.y - 1.5, 3, 3); });
ctx.fillStyle = '#facc15';
found.forEach(function (p) { ctx.beginPath(); ctx.arc(p.x, p.y, 3, 0, Math.PI * 2); ctx.fill(); });
ctx.strokeStyle = '#facc15';
ctx.lineWidth = 2;
ctx.strokeRect(q.x, q.y, q.w, q.h);
if (frameCount++ % 6 === 0) {
var pct = points.length ? Math.round((stats.checks / points.length) * 100) : 0;
document.getElementById('qtStats').innerHTML =
stat('points found in the box', found.length) +
stat('points tested with the quadtree', stats.checks, true) +
stat('points a brute-force scan tests', points.length) +
stat('work compared with brute force', pct + '%', true);
}
requestAnimationFrame(frame);
}
function toCanvas(e) {
var r = canvas.getBoundingClientRect();
return { x: (e.clientX - r.left) * (W / r.width), y: (e.clientY - r.top) * (H / r.height) };
}
canvas.addEventListener('pointermove', function (e) { var p = toCanvas(e); query.x = p.x; query.y = p.y; });
canvas.addEventListener('click', function (e) {
var p = toCanvas(e);
for (var i = 0; i < 12; i++) points.push({ x: p.x + (Math.random() - 0.5) * 30, y: p.y + (Math.random() - 0.5) * 30, vx: (Math.random() - 0.5), vy: (Math.random() - 0.5) });
});
function syncOutputs() {
document.getElementById('qtNOut').textContent = document.getElementById('qtN').value;
document.getElementById('qtCapOut').textContent = document.getElementById('qtCap').value;
}
document.getElementById('qtN').addEventListener('input', function () { makePoints(Number(this.value)); syncOutputs(); });
document.getElementById('qtCap').addEventListener('input', syncOutputs);
makePoints(600);
syncOutputs();
requestAnimationFrame(frame);Step by step
How to Use
- 1Move the pointerThe yellow box queries the tree around it; found points turn yellow.
- 2Read the countersCompare quadtree tests with a brute-force scan.
- 3Change the capacitySee how the subdivision and the work change.
- 4Change the point countFrom 50 to 2,000 clustered points.
- 5Click to add pointsWatch cells split where points pile up.
Real-world uses
Common Use Cases
Got questions?
Frequently Asked Questions
A tree in which each node covers a rectangle and has either up to a fixed number of points or four children covering the four quadrants of its rectangle. It adapts to the data, with small cells where points are dense.
A query can skip every node whose rectangle doesn't overlap the search area, so it tests only points in nearby cells. For clustered data and small search areas, that is a small fraction of all points.
Small capacities create deep trees with more nodes to traverse; large capacities make each leaf a longer brute-force list. Values between 4 and 16 are common; measure with your own data.
For moving objects and a few thousand points, rebuilding is simple and fast. For very large, mostly static datasets, update only the objects that move.
A grid uses fixed-size cells, which is simple and fast when data is evenly spread. A quadtree adapts cell size to density, which works better for clustered data.