Learn Coding Visually
Learn to code with interactive, live-preview playgrounds — HTML, CSS, JavaScript, React & more.
 HTML Playground42 lessons · Click-based · Live preview
 CSS PlaygroundLearn CSS with a live editor
 JavaScript Playground60 lessons · DOM · Async · Canvas
 React PlaygroundLearn React with a live code editor
 GSAP PlaygroundLearn GSAP animation interactively
 SVG Playground44 lessons · shapes · paths · animation
 SCSS Playground45 lessons · Sass modules · tokens
 Tailwind PlaygroundLearn Tailwind CSS with a live editor
 Bootstrap 5 Playground50 lessons · live preview
Big-O Complexity Growth Visualizer — Free Interactive Chart and Calculator
Big-O Complexity Growth Visualizer · Visualizers · Plain HTML, CSS & JS · Live preview
What's included
Features
About this UI Snippet
Big-O Notation — What the Growth Classes Mean in Real Time
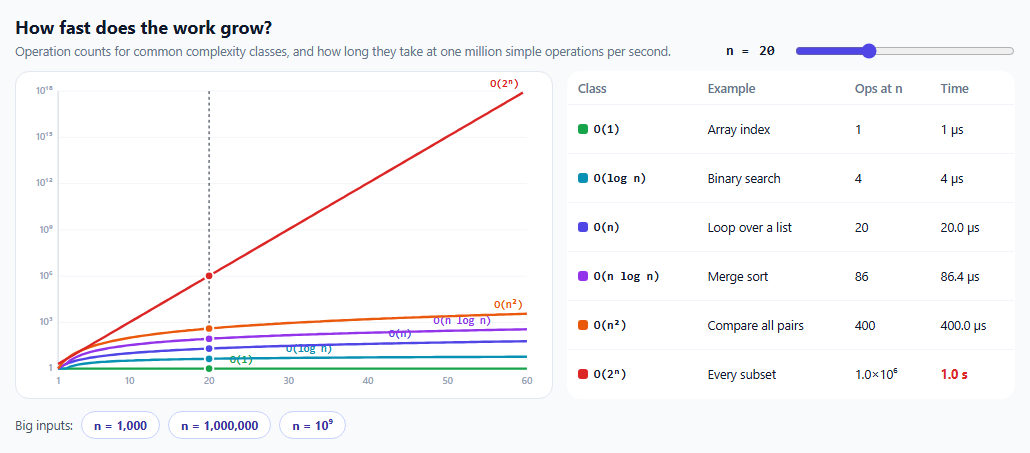
Big-O notation describes how the amount of work an algorithm does grows as its input grows. It's easy to memorise "O(n log n) is better than O(n²)", and much more convincing to see how large the gap becomes. This visualizer plots six common complexity classes and translates their operation counts into time.
Log scale, on purpose
The y-axis is logarithmic: each gridline is a thousand times the previous one. On a linear axis, O(2ⁿ) shoots off the chart by n ≈ 20 and flattens every other curve against the floor. On a log axis you can see all six at once — and notice that O(2ⁿ) is a straight line, which is exactly what exponential growth looks like on a log scale.
From operations to seconds
The table converts each class into operations for the chosen n and into time, assuming a million simple operations per second. That's a deliberately simple model: real code has constant factors and caches, but the ranking and the order of magnitude hold. Rows that take over a second turn red.
The big-input buttons
At n = 1,000,000 an O(n log n) sort finishes in about 20 seconds under this model, while an O(n²) algorithm needs around 11 days. At n = 10⁹ the gap becomes the difference between hours and tens of thousands of years. This is why the choice of algorithm dominates micro-optimisation for large inputs.
Examples per class
Each row names a typical operation: constant time for array indexing, logarithmic for binary search, linear for a single loop, n log n for efficient sorting, quadratic for comparing every pair, and exponential for trying every subset.
What Big-O leaves out
Big-O ignores constant factors and lower-order terms. For small n, a "worse" algorithm with a tiny constant can win — which is why sorting libraries switch to insertion sort for short arrays.
Build with AI
Build, Understand, Optimize, and Extend It With AI
Paste this visualizer into an AI assistant like Claude and ask it to explain why an exponential curve is a straight line on a log axis. Ask it to add O(n³) and O(n!) classes, a toggle between linear and log scale, a field to set the operations-per-second assumption, or a mode that times real JavaScript functions (a loop, nested loops, a sort) and plots measured results next to the theory.
Prompt to recreate it
Copy this into your AI assistant of choice to build the effect from scratch, or as a jumping-off point for your own variant:
Build a Big-O complexity growth visualizer in plain HTML, CSS and JavaScript with a hand-built SVG chart.

Requirements:
- Six classes: O(1), O(log n), O(n), O(n log n), O(n²) and O(2ⁿ), each with a colour and an example operation.
- Plot all six from n = 1 to 60 on a logarithmic y-axis with gridlines at powers of 1,000 and labelled ticks.
- A slider for n that moves a dashed vertical line and a labelled dot on each curve.
- A table with each class's operation count at n (scientific notation for huge values) and the time at one million operations per second, formatted from microseconds to years, with rows over one second highlighted.
- Buttons for n = 1,000, 1,000,000 and 1,000,000,000 that list the time for each class, describing 2ⁿ at those sizes as longer than the age of the universe.
Want to tighten it up first? Run this prompt through the AI Prompt Studio to score it across 8 quality dimensions, catch anti-patterns, and tune the wording for Claude, ChatGPT, or Gemini before you paste it in.
Source Code
<div class="bo">
  <div class="bo-top">
    <div>
      <h2>How fast does the work grow?</h2>
      <p>Operation counts for common complexity classes, and how long they take at one million simple operations per second.</p>
    </div>
    <label class="bo-n">n = <output id="boNOut"></output>
      <input type="range" id="boN" min="1" max="60" value="20" aria-label="Input size n">
    </label>
  </div>
  <div class="bo-grid">
    <svg id="boSvg" viewBox="0 0 560 340" role="img" aria-label="Growth curves"></svg>
    <table class="bo-table">
      <thead><tr><th>Class</th><th>Example</th><th>Ops at n</th><th>Time</th></tr></thead>
      <tbody id="boRows"></tbody>
    </table>
  </div>
  <div class="bo-scale">
    <span>Big inputs:</span>
    <button type="button" data-n="1000">n = 1,000</button>
    <button type="button" data-n="1000000">n = 1,000,000</button>
    <button type="button" data-n="1000000000">n = 10⁹</button>
    <div id="boBig" class="bo-big" aria-live="polite"></div>
  </div>
</div>*{box-sizing:border-box;margin:0;padding:0}
body{font-family:system-ui,-apple-system,sans-serif;background:#f8fafc;color:#0f172a;min-height:100vh;display:flex;align-items:center;justify-content:center;padding:20px}
.bo{width:100%;max-width:1000px}
.bo-top{display:flex;justify-content:space-between;align-items:flex-end;gap:14px;flex-wrap:wrap}
.bo h2{font-size:18px}
.bo-top p{font-size:12.5px;color:#64748b;margin-top:4px}
.bo-n{display:flex;align-items:center;gap:10px;font:700 14px ui-monospace,monospace}
.bo-n input{width:220px;accent-color:#4f46e5}
.bo-n output{min-width:26px}
.bo-grid{display:grid;grid-template-columns:1.2fr 1fr;gap:14px;margin-top:12px}
@media (max-width:820px){.bo-grid{grid-template-columns:1fr}}
#boSvg{width:100%;background:#fff;border:1px solid #e2e8f0;border-radius:14px}
#boSvg .ax{stroke:#cbd5e1}
#boSvg .gl{stroke:#f1f5f9}
#boSvg .tick{font:600 10px system-ui;fill:#94a3b8}
#boSvg path{fill:none;stroke-width:2.5}
#boSvg .nline{stroke:#0f172a;stroke-dasharray:3 3}
#boSvg .lbl{font:800 11px ui-monospace,monospace}
.bo-table{width:100%;border-collapse:collapse;background:#fff;border:1px solid #e2e8f0;border-radius:14px;overflow:hidden;font-size:12.5px}
.bo-table th,.bo-table td{padding:8px 10px;text-align:left;border-bottom:1px solid #f1f5f9}
.bo-table th{color:#64748b;font-weight:600}
.bo-table td:first-child{font:800 12px ui-monospace,monospace;white-space:nowrap}
.bo-table td:nth-child(3),.bo-table td:nth-child(4){font-variant-numeric:tabular-nums;white-space:nowrap}
.bo-table i{display:inline-block;width:10px;height:10px;border-radius:3px;margin-right:6px;vertical-align:-1px}
.bo-table tr.slow td:last-child{color:#dc2626;font-weight:700}
.bo-scale{margin-top:12px;display:flex;align-items:center;gap:8px;flex-wrap:wrap;font-size:12.5px;color:#475569}
.bo-scale button{border:1px solid #c7d2fe;background:#fff;color:#3730a3;border-radius:999px;padding:5px 12px;font:700 12px system-ui;cursor:pointer}
.bo-scale button:focus-visible,.bo-n input:focus-visible{outline:2px solid #6366f1;outline-offset:2px}
.bo-big{flex-basis:100%;background:#fff;border:1px solid #e2e8f0;border-radius:12px;padding:10px 12px;line-height:1.7;min-height:20px}
.bo-big:empty{display:none}var CLASSES = [
{ id: 'O(1)', ex: 'Array index', color: '#16a34a', f: function (n) { return 1; } },
{ id: 'O(log n)', ex: 'Binary search', color: '#0891b2', f: function (n) { return Math.max(1, Math.log2(n)); } },
{ id: 'O(n)', ex: 'Loop over a list', color: '#4f46e5', f: function (n) { return n; } },
{ id: 'O(n log n)', ex: 'Merge sort', color: '#9333ea', f: function (n) { return n * Math.max(1, Math.log2(n)); } },
{ id: 'O(n²)', ex: 'Compare all pairs', color: '#ea580c', f: function (n) { return n * n; } },
{ id: 'O(2ⁿ)', ex: 'Every subset', color: '#dc2626', f: function (n) { return Math.pow(2, n); } },
];
var OPS_PER_SEC = 1e6;
var svg = document.getElementById('boSvg');
var NS = 'http://www.w3.org/2000/svg';
var X0 = 44, Y0 = 310, PW = 490, PH = 290, NMAX = 60;
var LABEL_AT = { 'O(1)': 26, 'O(log n)': 36, 'O(n)': 46, 'O(n log n)': 56 };
// A log scale on the y-axis: on a linear axis, 2ⁿ would flatten every other
// curve into the floor after n ≈ 10. Each gridline is 10× the one below.
var YMAX = 18; // 10^18
function sy(v) { return Y0 - (Math.log10(Math.max(1, v)) / YMAX) * PH; }
function sx(n) { return X0 + ((n - 1) / (NMAX - 1)) * PW; }
function fmtOps(v) {
if (v < 1e4) return Math.round(v).toLocaleString('en-US');
var e = Math.floor(Math.log10(v));
return (v / Math.pow(10, e)).toFixed(1) + '×10' + String(e).split('').map(function (d) { return '⁰¹²³⁴⁵⁶⁷⁸⁹'[d]; }).join('');
}
function fmtTime(ops) {
var s = ops / OPS_PER_SEC;
if (s < 1e-3) return (s * 1e6).toFixed(s < 1e-5 ? 0 : 1) + ' µs';
if (s < 1) return (s * 1e3).toFixed(1) + ' ms';
if (s < 60) return s.toFixed(1) + ' s';
if (s < 3600) return (s / 60).toFixed(1) + ' min';
if (s < 86400) return (s / 3600).toFixed(1) + ' hours';
if (s < 3.15e7) return (s / 86400).toFixed(1) + ' days';
var years = s / 3.15e7;
return years < 1e6 ? Math.round(years).toLocaleString('en-US') + ' years' : fmtOps(years) + ' years';
}
function el(tag, attrs, text) {
var e = document.createElementNS(NS, tag);
Object.keys(attrs).forEach(function (k) { e.setAttribute(k, attrs[k]); });
if (text !== undefined) e.textContent = text;
svg.appendChild(e);
return e;
}
function drawAxes() {
for (var p = 0; p <= YMAX; p += 3) {
el('line', { x1: X0, x2: X0 + PW, y1: sy(Math.pow(10, p)), y2: sy(Math.pow(10, p)), class: 'gl' });
el('text', { x: X0 - 6, y: sy(Math.pow(10, p)) + 3, class: 'tick', 'text-anchor': 'end' }, p === 0 ? '1' : '10' + '⁰¹²³⁴⁵⁶⁷⁸⁹'.charAt(p % 10).replace(/./, function () { return String(p).split('').map(function (d) { return '⁰¹²³⁴⁵⁶⁷⁸⁹'[d]; }).join(''); }));
}
[1, 10, 20, 30, 40, 50, 60].forEach(function (n) { el('text', { x: sx(n), y: Y0 + 16, class: 'tick', 'text-anchor': 'middle' }, n); });
el('line', { x1: X0, x2: X0, y1: Y0 - PH, y2: Y0, class: 'ax' });
el('line', { x1: X0, x2: X0 + PW, y1: Y0, y2: Y0, class: 'ax' });
CLASSES.forEach(function (c) {
var d = '', endX = 0, endY = 0;
for (var n = 1; n <= NMAX; n += 0.5) {
var v = c.f(n);
if (Math.log10(v) > YMAX) break;
endX = sx(n); endY = sy(v);
d += (d ? 'L' : 'M') + endX.toFixed(1) + ',' + endY.toFixed(1);
}
el('path', { d: d, stroke: c.color });
// The slow-growing classes sit close together on a log axis, so their
// labels are spread out along x instead of stacked at the right edge.
var at = LABEL_AT[c.id];
var lx = at ? sx(at) : endX, ly = at ? sy(c.f(at)) : endY;
el('text', { x: lx - 4, y: ly - 6, class: 'lbl', fill: c.color, 'text-anchor': 'end' }, c.id);
});
}
var nLine, dots = [];
function update() {
var n = Number(document.getElementById('boN').value);
document.getElementById('boNOut').textContent = n;
if (!nLine) {
nLine = el('line', { y1: Y0 - PH, y2: Y0, class: 'nline' });
CLASSES.forEach(function (c) {
dots.push({ c: c, dot: el('circle', { r: 4.5, fill: c.color, stroke: '#fff', 'stroke-width': 2 }) });
});
}
nLine.setAttribute('x1', sx(n)); nLine.setAttribute('x2', sx(n));
dots.forEach(function (d) {
var v = d.c.f(n);
var y = Math.log10(v) > YMAX ? Y0 - PH : sy(v);
d.dot.setAttribute('cx', sx(n)); d.dot.setAttribute('cy', y);
});
document.getElementById('boRows').innerHTML = CLASSES.map(function (c) {
var ops = c.f(n);
var slow = ops / OPS_PER_SEC > 1;
return '<tr class="' + (slow ? 'slow' : '') + '"><td><i style="background:' + c.color + '"></i>' + c.id + '</td><td>' + c.ex + '</td><td>' + fmtOps(ops) + '</td><td>' + fmtTime(ops) + '</td></tr>';
}).join('');
}
document.querySelectorAll('.bo-scale button').forEach(function (b) {
b.addEventListener('click', function () {
var n = Number(b.dataset.n);
document.getElementById('boBig').innerHTML = '<b>n = ' + n.toLocaleString('en-US') + '</b> at 10⁶ ops/second: ' +
CLASSES.map(function (c) {
var ops = c.id === 'O(2ⁿ)' ? Infinity : c.f(n);
return '<b style="color:' + c.color + '">' + c.id + '</b> ' + (ops === Infinity ? 'longer than the age of the universe' : fmtTime(ops));
}).join(' · ');
});
});
drawAxes();
document.getElementById('boN').addEventListener('input', update);
update();Step by step
How to Use
- 1Drag nFrom 1 to 60; the dashed line and dots move along every curve.
- 2Read the tableOperation counts and time at 10⁶ operations per second.
- 3Watch rows turn redAnything over a second is highlighted.
- 4Try big inputsButtons compute times for n = 1,000, 10⁶ and 10⁹.
- 5Note the straight lineExponential growth is linear on a log axis.
Real-world uses
Common Use Cases
Got questions?
Frequently Asked Questions
It describes an upper bound on how an algorithm's work grows with input size n, ignoring constant factors and lower-order terms. O(n) means the work grows proportionally to n; O(n²) means doubling n roughly quadruples the work.
Exponential and quadratic growth become so large that on a linear axis every slower-growing curve looks flat. A log scale compresses large values so all classes can be compared, and it shows exponential growth as a straight line.
Only by a factor of log n, which is about 20 for a million items and 30 for a billion. That's why efficient sorting is practical even for very large inputs.
Not for small inputs. Constant factors, memory access patterns and overhead can make an O(n²) algorithm faster than an O(n log n) one for small n. Big-O describes how cost scales, not the cost at one size.
It is a simple teaching model. Modern CPUs do far more basic operations per second, but real algorithms do more work per step. The comparison between classes, not the absolute time, is the point.