Learn Coding Visually
Learn to code with interactive, live-preview playgrounds — HTML, CSS, JavaScript, React & more.
 HTML Playground42 lessons · Click-based · Live preview
 CSS PlaygroundLearn CSS with a live editor
 JavaScript Playground60 lessons · DOM · Async · Canvas
 React PlaygroundLearn React with a live code editor
 GSAP PlaygroundLearn GSAP animation interactively
 SVG Playground44 lessons · shapes · paths · animation
 SCSS Playground45 lessons · Sass modules · tokens
 Tailwind PlaygroundLearn Tailwind CSS with a live editor
 Bootstrap 5 Playground50 lessons · live preview
Scroll Thermometer Fill — Free HTML CSS JS Snippet
Scroll Thermometer Fill · Scroll · Plain HTML, CSS & JS · Live preview
What's included
Features
About this UI Snippet
Scroll Thermometer Fill — SVG clip-path Fill, GSAP Proxy Object & Number Counting
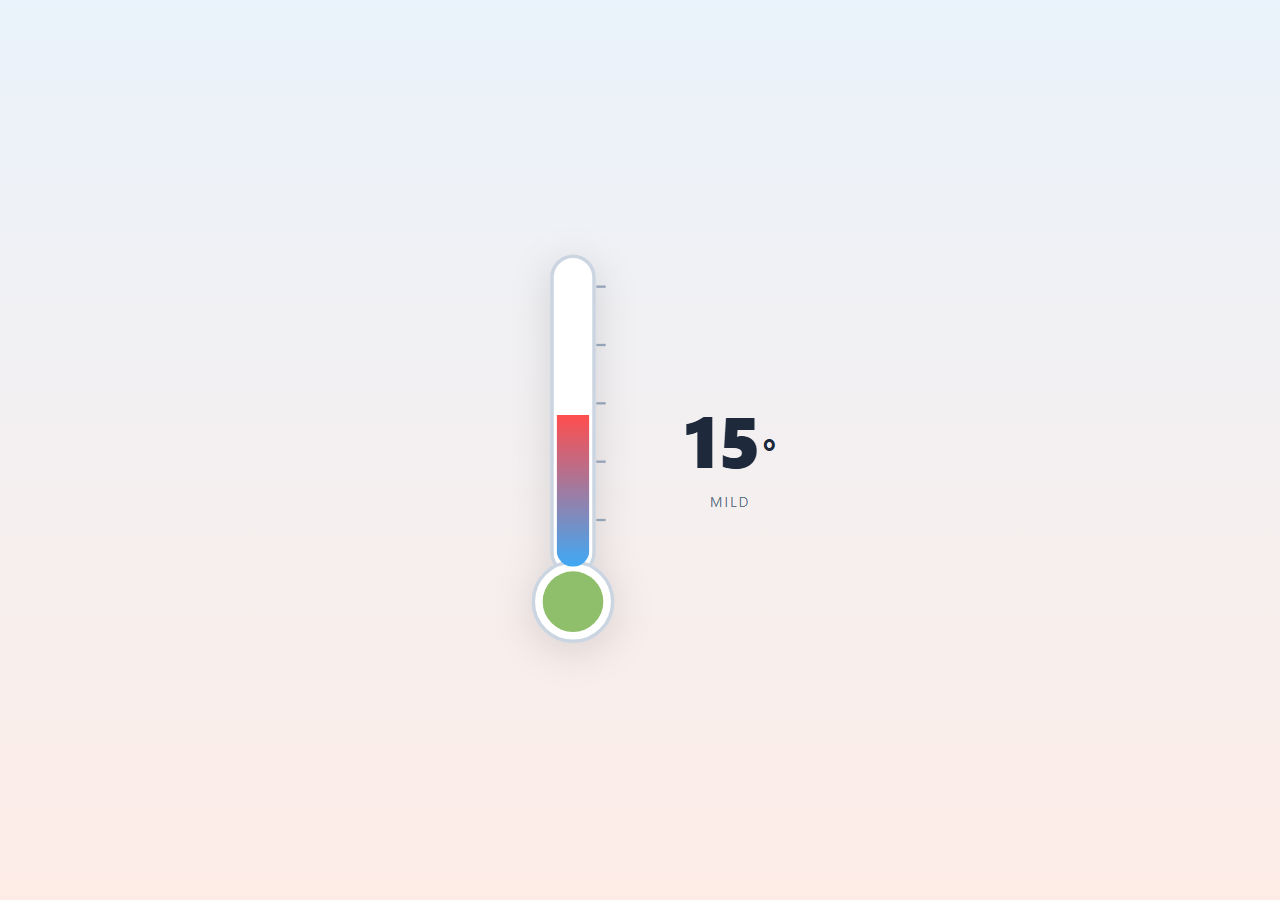
This snippet builds an illustrated SVG thermometer whose mercury column height, on-screen number readout, and gradient color all rise together as the user scrolls, driven by a single GSAP tween animating one plain JavaScript object used as an animation proxy.
A proxy object instead of animating the SVG directly
Rather than creating several separate tweens for the number, the fill height, and any color logic, one plain object { value: minTemp, h: 0 } is the sole target of a single gsap.to() call. GSAP interpolates both value (the temperature) and h (the mercury height in pixels) simultaneously, and an onUpdate callback reads the current interpolated values on every tick to update the DOM — this is the standard GSAP pattern for driving multiple visually-different outputs (text content, SVG attributes, color) from one synchronized progress source.
The mercury fill via a clipped, height-animated rect
The mercury is an SVG <rect> inside a <clipPath> shaped like the tube, whose y and height attributes are recalculated every frame so the rect grows upward from the bulb (y = 280 - h) while staying clipped to the tube's rounded shape — a straightforward SVG equivalent of a CSS height-based fill bar.
Color driven by a gradient plus threshold-based bulb recoloring
The mercury itself uses a fixed linearGradient from blue to red along its length, so as more of it becomes visible the visible portion naturally shows more of the warm end. The bulb's fill color is separately swapped between five threshold colors from a words array (matching FREEZING/COLD/MILD/WARM/HOT labels) by finding the highest threshold not yet exceeded by the current counter.value — the same threshold-lookup pattern used for the weather-state label in Scroll Weather Scene Transition.
Live number counting
tempNum.textContent = Math.round(counter.value) runs every frame inside the same onUpdate, so the number counts up in perfect lockstep with the visual fill rising — no separate counting animation or rounding drift between the two.
Fully reversible
Because the whole thing is one scrubbed tween on a proxy object, scrolling back up smoothly counts the number back down and drains the mercury fill in unison.
See also Scroll Number Odometer for a related live-counting pattern.
Build with AI
Build, Understand, Optimize, and Extend It With AI
Paste this snippet's HTML, CSS and JS into an AI coding assistant and ask it to explain the proxy-object animation pattern — why GSAP tweens a plain { value, h } object instead of the SVG element's attributes directly, and how the single onUpdate callback keeps the number, fill height, and threshold color perfectly synchronized. It's a strong candidate to extend: ask the assistant to add a subtle bubble-rising particle effect inside the mercury as it climbs, to make the tick-mark labels show actual numeric values instead of blank lines, or to add a horizontal gauge variant using the same proxy-object technique but animating width instead of height.
Prompt to recreate it
Copy this into your AI assistant of choice to build the effect from scratch, or as a jumping-off point for your own variant:
Build a scroll-driven SVG thermometer fill animation in HTML, CSS and JavaScript using GSAP and ScrollTrigger — no canvas, no WebGL.

Requirements:
- Draw an SVG thermometer: a rounded outer tube outline, a circular bulb at the bottom, a few tick marks along the side, and an inner "mercury" rect clipped to the tube's rounded shape via an SVG clipPath so it can grow without spilling outside the tube outline.
- Give the mercury a linearGradient fill running from a cool blue at the bottom to a warm red at the top.
- Create one plain JavaScript object to serve as a GSAP animation proxy with at least a numeric "value" (representing temperature) and an "h" (representing mercury pixel height), and animate both properties together in a single GSAP tween attached to a tall scroll section via ScrollTrigger with scrub: true.
- Inside that tween's onUpdate callback, update the mercury rect's y and height SVG attributes to grow it from the bulb upward, update a large numeric text readout to show the rounded current temperature value, and look up the highest threshold in a small array of { threshold, label, color } stages not yet exceeded by the current value to update both a text label (e.g. "COLD", "WARM", "HOT") and the thermometer bulb's fill color.
- The entire animation must play forward and reverse cleanly and smoothly as the user scrolls down and back up, since everything derives from one scrubbed tween.
- Use a cool blue to warm red color palette throughout, on a light clinical background.
Want to tighten it up first? Run this prompt through the AI Prompt Studio to score it across 8 quality dimensions, catch anti-patterns, and tune the wording for Claude, ChatGPT, or Gemini before you paste it in.
Source Code
<div class="hint">Scroll ↓ to heat things up</div>
<div class="therm-wrap">
  <div class="therm-stage">
    <svg viewBox="0 0 120 360" class="therm-svg">
      <defs>
        <clipPath id="tubeClip">
          <rect x="46" y="20" width="28" height="260" rx="14" />
        </clipPath>
        <linearGradient id="mercuryGrad" x1="0" y1="1" x2="0" y2="0">
          <stop offset="0%" stop-color="#3fa9f5" />
          <stop offset="100%" stop-color="#ff4d4d" />
        </linearGradient>
      </defs>
      <rect x="42" y="14" width="36" height="272" rx="18" class="tube-outline" />
      <circle cx="60" cy="310" r="34" class="tube-outline" />
      <g clip-path="url(#tubeClip)">
        <rect id="mercuryFill" x="46" y="280" width="28" height="0" fill="url(#mercuryGrad)" />
      </g>
      <circle cx="60" cy="310" r="26" id="bulb" fill="#3fa9f5" />
      <g class="ticks">
        <line x1="80" y1="40" x2="88" y2="40" />
        <line x1="80" y1="90" x2="88" y2="90" />
        <line x1="80" y1="140" x2="88" y2="140" />
        <line x1="80" y1="190" x2="88" y2="190" />
        <line x1="80" y1="240" x2="88" y2="240" />
      </g>
    </svg>
    <div class="readout">
      <span class="temp-num" id="tempNum">0</span><span class="deg">°</span>
      <div class="temp-word" id="tempWord">FREEZING</div>
    </div>
  </div>
</div>
* { box-sizing: border-box; }
body { margin: 0; font-family: system-ui, sans-serif; background: #eef4fb; }
.hint { text-align: center; padding: 28px 16px; font-size: 14px; color: #64748b; }
.therm-wrap { height: 400vh; position: relative; }
.therm-stage { position: sticky; top: 0; height: 100vh; display: flex; align-items: center; justify-content: center; gap: 40px; flex-wrap: wrap; background: linear-gradient(180deg, #eaf3fb, #fdece6); }
.therm-svg { width: 140px; height: auto; filter: drop-shadow(0 8px 20px rgba(0,0,0,0.12)); }
.tube-outline { fill: #fff; stroke: #cbd5e1; stroke-width: 3; }
.ticks line { stroke: #94a3b8; stroke-width: 2; }
.readout { text-align: center; font-variant-numeric: tabular-nums; }
.temp-num { font-size: 72px; font-weight: 800; color: #1e293b; }
.deg { font-size: 40px; font-weight: 700; color: #1e293b; }
.temp-word { font-size: 14px; letter-spacing: 0.14em; color: #64748b; margin-top: 6px; }
@media (max-width: 640px) { .therm-stage { gap: 20px; } .therm-svg { width: 100px; } .temp-num { font-size: 52px; } }gsap.registerPlugin(ScrollTrigger);
const mercury = document.getElementById('mercuryFill');
const tempNum = document.getElementById('tempNum');
const tempWord = document.getElementById('tempWord');
const bulb = document.getElementById('bulb');
const maxHeight = 260;
const minTemp = -10;
const maxTemp = 40;
const counter = { value: minTemp, h: 0 };
const words = [
{ t: minTemp, w: 'FREEZING', c: '#3fa9f5' },
{ t: 5, w: 'COLD', c: '#5bb8f0' },
{ t: 15, w: 'MILD', c: '#8fbf6a' },
{ t: 25, w: 'WARM', c: '#f5a623' },
{ t: maxTemp, w: 'HOT', c: '#ff4d4d' },
];
gsap.timeline({
scrollTrigger: {
trigger: '.therm-wrap',
start: 'top top',
end: 'bottom bottom',
scrub: true,
},
})
.to(counter, {
value: maxTemp,
h: maxHeight,
ease: 'none',
onUpdate: () => {
tempNum.textContent = Math.round(counter.value);
mercury.setAttribute('y', 280 - counter.h);
mercury.setAttribute('height', counter.h);
let current = words[0];
for (const w of words) { if (counter.value >= w.t) current = w; }
tempWord.textContent = current.w;
bulb.setAttribute('fill', current.c);
},
});
ScrollTrigger.refresh();Step by step
How to Use
- 1Scroll through the previewScroll down slowly — the mercury rises, the number counts up, and the bulb and word label shift from cold blue to hot red.
- 2Change the temperature rangeEdit minTemp and maxTemp in the JS panel to change the counted range, and maxHeight to match your SVG tube's pixel height.
- 3Edit the threshold words and colorsEdit the words array's t (threshold), w (label text), and c (color) entries to change how many stages the readout passes through.
- 4Restyle the SVGAdjust the tube, bulb and tick mark SVG shapes directly in the HTML panel — the mercury fill rect automatically fills whatever clip-path shape you define.
- 5Change the fill gradientEdit the #mercuryGrad stop-color values to change the cool-to-warm color transition along the mercury column itself.
- 6Export in your formatClick "HTML" for a standalone file, "JSX" for a React component, or "Tailwind" for a React + Tailwind version.
Real-world uses
Common Use Cases
Got questions?
Frequently Asked Questions
A proxy object lets GSAP interpolate a temperature value and a pixel height in one place, then one onUpdate callback fans that single source of truth out to the number text, SVG attributes, and threshold-based color — keeping everything perfectly synchronized without multiple competing tweens.
The mercury rect sits inside an SVG <clipPath> shaped like the tube (a rounded rect matching the outline), so no matter how tall the rect grows, only the portion inside that clip shape is ever visible.
Add more entries to the words array with their own t (threshold), w (label), and c (bulb color) — the lookup loop automatically picks the highest threshold not yet exceeded by the current value.
Yes — change minTemp/maxTemp to your value range, update the deg symbol and word labels, and the same fill/counter mechanism works for any single rising metric.
The .temp-num class uses font-variant-numeric: tabular-nums so every digit occupies the same fixed width, preventing the layout from shifting as the counted number changes digit count.