Learn Coding Visually
Learn to code with interactive, live-preview playgrounds — HTML, CSS, JavaScript, React & more.
 HTML Playground42 lessons · Click-based · Live preview
 CSS PlaygroundLearn CSS with a live editor
 JavaScript Playground60 lessons · DOM · Async · Canvas
 React PlaygroundLearn React with a live code editor
 GSAP PlaygroundLearn GSAP animation interactively
 SVG Playground44 lessons · shapes · paths · animation
 SCSS Playground45 lessons · Sass modules · tokens
 Tailwind PlaygroundLearn Tailwind CSS with a live editor
 Bootstrap 5 Playground50 lessons · live preview
Scroll Satellite Ground Track Map — Free HTML CSS JS Snippet
Scroll Satellite Ground Track Map · Scroll · Plain HTML, CSS & JS · Live preview
What's included
Features
About this UI Snippet
Scroll Satellite Ground Track Map — getPointAtLength Travel, Trail Reveal & Scrubbed Telemetry
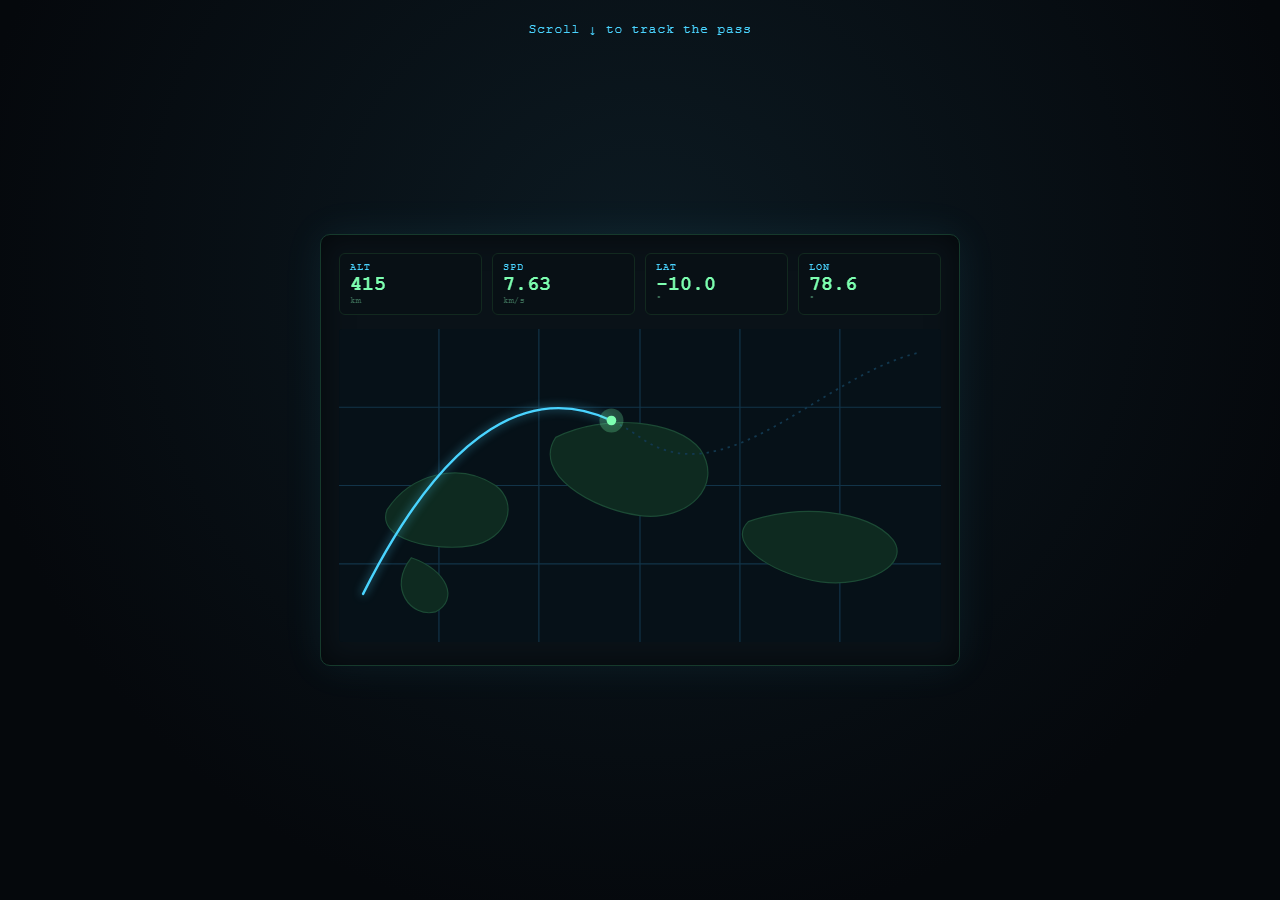
A mission-control telemetry dashboard where a satellite icon travels a curved ground-track path across a simplified dark world map, leaving a glowing trail behind it, while altitude/speed/lat/lon readouts update live — all driven by scroll position. Pair with Scroll SVG Path Draw for the trail-drawing technique on its own, or Scroll Number Odometer for a focused numeric-counter pattern. This is a deliberately different read from a travel-journey map story — the aesthetic and data language here are mission-control telemetry, not a narrative journey.
Two overlapping paths: one static, one revealing
#track is a static dotted guide line (stroke-dasharray: 2 4) showing the satellite's full planned path faintly at all times. #trail is an identical path drawn directly on top of it, but starts fully hidden via stroke-dasharray/stroke-dashoffset both set to its total length — as scroll progresses, its dash-offset is reduced, progressively revealing a bright cyan trail exactly tracing where the satellite has already been.
The satellite's live position via getPointAtLength
The same scroll-mapped progress value used for the trail reveal also drives track.getPointAtLength(d * len), giving the exact coordinate the satellite should be at. A <g> group containing the satellite dot and a soft glow circle is repositioned there each frame via an SVG transform: translate(...) — grouping both shapes together means the glow always stays perfectly centered on the dot with a single transform update.
Telemetry driven by two parallel tweens
One tween animates the scroll-progress object { d: 0 } for trail/position; a second, independent tween on the same timeline animates { alt: 408→421, spd: 7.66→7.59 } with a sine.inOut ease, simulating the natural rise-and-slow of an orbit. Latitude and longitude are instead computed directly as functions of d (including a sine wiggle on longitude) rather than tweened, showing two different valid approaches to scroll-synced number readouts.
Why pin: true
Mission-control dashboards are inherently a fixed "console" the operator watches — pinning the whole console for end: '+=220%' of scroll keeps that framing intact, and because every visible change (trail, satellite position, all four readouts) derives from the same scrubbed progress, scrolling back up retracts the trail and walks every number back down in sync.
Build with AI
Build, Understand, Optimize, and Extend It With AI
The key idea worth understanding here is using one shared progress value to drive both an SVG stroke-dashoffset reveal and a getPointAtLength marker position, so a trail and its "leading" marker never drift apart — ask an AI assistant to explain why deriving both from the same value matters, and what would go wrong if you tweened the marker's position independently instead. It's also worth asking the assistant to compare the two telemetry approaches used here (a separately-tweened object vs. values computed directly as a function of progress) and discuss when each is preferable. To extend the snippet, ask for multiple simultaneous satellite passes, a "signal lost" state when the satellite crosses a specific longitude, or telemetry values that snap rather than tween. Use this as a technique reference, not a finished tracking system.
Prompt to recreate it
Copy this into your AI assistant of choice to build the effect from scratch, or as a jumping-off point for your own variant:
Build a scroll-scrubbed "satellite ground track" mission-control dashboard in plain HTML, CSS, and JavaScript using GSAP and ScrollTrigger — real SVG, no map library, no canvas.

Requirements:
- Create a dark dashboard console containing a telemetry readout row (4 labeled numeric stats, e.g. altitude, speed, latitude, longitude) above an SVG "map" area.
- In the SVG map, draw several simplified abstract continent shapes as filled <path> elements, plus a light grid of horizontal and vertical lines for a technical map-grid feel — no real geographic data needed.
- Draw a curved ground-track path across the map using a <path> with cubic Bezier curve commands, rendered faintly as a static dotted guide line (short stroke-dasharray).
- Draw a second path with the exact same "d" coordinates on top of the first, styled with a bright glowing stroke color. On page load, get its total length and set both stroke-dasharray and stroke-dashoffset to that length, hiding it completely.
- Create a small SVG group containing a satellite dot and a soft larger glow circle behind it.
- Create one GSAP timeline whose scrollTrigger has pin: true, a numeric scrub value, and generous scroll distance (e.g. end: "+=220%").
- In that timeline, tween a plain object's progress property from 0 to 1 with ease: "none". On every onUpdate: reduce the bright trail path's stroke-dashoffset proportionally to reveal it, and call the static guide path's getPointAtLength(progress * totalLength) to reposition the satellite group's SVG transform to that exact point.
- On the same timeline, separately compute or tween 4 telemetry numbers (altitude, speed, latitude, longitude) as functions of the same progress value or via a second parallel tween with different easing, and update their displayed text on every update.
- Confirm scrolling back up retracts the trail, moves the satellite back along the path, and counts every telemetry number back down, since everything derives from the same scrubbed progress.
- Style it with a mission-control dark navy/black background, green and cyan telemetry text, and a subtle glow on the trail and satellite dot.
Want to tighten it up first? Run this prompt through the AI Prompt Studio to score it across 8 quality dimensions, catch anti-patterns, and tune the wording for Claude, ChatGPT, or Gemini before you paste it in.
Source Code
<div class="hint">Scroll ↓ to track the pass</div>
<section class="mission-stage">
  <div class="console">
    <div class="telemetry">
      <div class="stat"><span class="label">ALT</span><span class="val" id="alt">408</span><span class="unit">km</span></div>
      <div class="stat"><span class="label">SPD</span><span class="val" id="spd">7.66</span><span class="unit">km/s</span></div>
      <div class="stat"><span class="label">LAT</span><span class="val" id="lat">-12.4</span><span class="unit">°</span></div>
      <div class="stat"><span class="label">LON</span><span class="val" id="lon">142.8</span><span class="unit">°</span></div>
    </div>
    <svg viewBox="0 0 500 260" class="map">
      <rect x="0" y="0" width="500" height="260" class="ocean" />
      <g class="grid">
        <line x1="0" y1="65" x2="500" y2="65" /><line x1="0" y1="130" x2="500" y2="130" /><line x1="0" y1="195" x2="500" y2="195" />
        <line x1="83" y1="0" x2="83" y2="260" /><line x1="166" y1="0" x2="166" y2="260" /><line x1="250" y1="0" x2="250" y2="260" />
        <line x1="333" y1="0" x2="333" y2="260" /><line x1="416" y1="0" x2="416" y2="260" />
      </g>
      <path class="land" d="M40,150 C60,120 100,110 130,130 C150,145 140,175 110,180 C80,185 30,175 40,150 Z" />
      <path class="land" d="M180,90 C220,70 280,75 300,100 C320,130 290,160 250,155 C210,150 160,120 180,90 Z" />
      <path class="land" d="M340,160 C380,145 440,150 460,175 C475,195 440,215 400,210 C365,205 320,180 340,160 Z" />
      <path class="land" d="M60,190 C90,200 100,225 80,235 C60,240 40,215 60,190 Z" />
      <path id="track" class="track" d="M20,220 C100,60 180,40 250,90 C320,140 400,40 480,20" />
      <path id="trail" class="trail" d="M20,220 C100,60 180,40 250,90 C320,140 400,40 480,20" />
      <g id="satGroup">
        <circle class="sat-glow" r="10" />
        <circle class="sat" r="4" />
      </g>
    </svg>
  </div>
</section>
<div class="spacer"></div>
* { box-sizing: border-box; }
body { margin: 0; font-family: 'Courier New', monospace; background: #060a10; color: #7dffb0; }
.hint { position: sticky; top: 12px; text-align: center; font-size: 13px; letter-spacing: 0.06em; color: #4ad4ff; z-index: 5; padding: 10px; }
.mission-stage { height: 100vh; display: flex; align-items: center; justify-content: center; background: radial-gradient(ellipse at 50% 30%, #0c1a22 0%, #05080c 75%); }
.spacer { height: 200vh; }
.console { width: min(92vw, 640px); background: #0a1218; border: 1px solid #163a2c; border-radius: 10px; padding: 18px; box-shadow: 0 0 40px rgba(77,212,255,0.08), inset 0 0 30px rgba(0,0,0,0.6); }
.telemetry { display: grid; grid-template-columns: repeat(4, 1fr); gap: 10px; margin-bottom: 14px; }
.stat { background: #081015; border: 1px solid #12291f; border-radius: 6px; padding: 8px 10px; display: flex; flex-direction: column; }
.label { font-size: 10px; color: #4ad4ff; letter-spacing: 0.1em; }
.val { font-size: 20px; font-weight: 700; color: #7dffb0; }
.unit { font-size: 9px; color: #3a6a55; }
.map { width: 100%; height: auto; background: #06121a; border-radius: 4px; }
.ocean { fill: #061118; }
.grid line { stroke: #123449; stroke-width: 1; }
.land { fill: #0e2a20; stroke: #1c4a35; stroke-width: 1; }
.track { fill: none; stroke: #12384f; stroke-width: 1.5; stroke-dasharray: 2 4; }
.trail { fill: none; stroke: #4ad4ff; stroke-width: 2; stroke-linecap: round; filter: drop-shadow(0 0 4px rgba(74,212,255,0.7)); }
.sat { fill: #7dffb0; }
.sat-glow { fill: #7dffb0; opacity: 0.25; }gsap.registerPlugin(ScrollTrigger);
var trail = document.getElementById('trail');
var track = document.getElementById('track');
var satGroup = document.getElementById('satGroup');
var len = trail.getTotalLength();
trail.style.strokeDasharray = len;
trail.style.strokeDashoffset = len;
var altEl = document.getElementById('alt');
var spdEl = document.getElementById('spd');
var latEl = document.getElementById('lat');
var lonEl = document.getElementById('lon');
var state = { d: 0, alt: 408, spd: 7.66 };
function update(d) {
trail.style.strokeDashoffset = len - d * len;
var p = track.getPointAtLength(d * len);
satGroup.setAttribute('transform', 'translate(' + p.x + ',' + p.y + ')');
latEl.textContent = (60 - d * 140).toFixed(1);
lonEl.textContent = (110 - d * 40 + Math.sin(d * 8) * 15).toFixed(1);
}
var tl = gsap.timeline({
scrollTrigger: {
trigger: '.mission-stage',
start: 'top top',
end: '+=220%',
scrub: 0.5,
pin: true,
},
});
tl.to(state, { d: 1, ease: 'none', duration: 1, onUpdate: function () { update(state.d); } }, 0)
.to(state, { alt: 421, spd: 7.59, duration: 1, ease: 'sine.inOut',
onUpdate: function () { altEl.textContent = state.alt.toFixed(0); spdEl.textContent = state.spd.toFixed(2); } }, 0);
update(0);Step by step
How to Use
- 1Scroll through the passScroll down slowly — the satellite travels its ground track, a cyan trail draws in behind it, and the telemetry readouts (ALT, SPD, LAT, LON) update live.
- 2Scroll back upThe trail retracts and every readout counts back down to its starting value, confirming full reversibility.
- 3Reshape the ground trackEdit the "d" attribute shared by #track and #trail in the HTML panel — keep both paths identical so the trail continues to match the guide line.
- 4Add another readoutAdd a new .stat block in the HTML telemetry grid and compute its value from the same "d" progress variable inside the update() function in the JS panel.
- 5Change the map shapesEdit the .land path "d" attributes in the HTML panel to sketch different simplified continent silhouettes.
- 6Export in your formatClick "HTML" for a standalone file, "JSX" for React, or "Tailwind" for a React + Tailwind version.
Real-world uses
Common Use Cases
Got questions?
Frequently Asked Questions
Both the visible trail and the satellite's position come from the same underlying path and the same scroll-mapped progress value. The trail's stroke-dashoffset reveals up to that progress, and path.getPointAtLength(progress * totalLength) returns the exact coordinate at that same point — so the dot always sits precisely at the trail's leading edge.
#track is a static, always-visible dotted guide showing the satellite's full planned route faintly. #trail is drawn directly on top of it with the exact same "d" coordinates, but starts hidden and progressively reveals as a bright, glowing line — giving a clear "traveled so far" vs. "full planned path" visual distinction.
Yes, deliberately, to show two valid approaches — latitude and longitude are computed directly as formulas of the scroll progress value, while altitude and speed are driven by a separate GSAP tween with its own easing curve, giving the orbit numbers a more organic rise-and-fall feel.
No — the continents are simplified, hand-drawn SVG path shapes purely for visual atmosphere, and the grid lines are evenly spaced decoration rather than accurate latitude/longitude gridlines. It is a stylized mission-control aesthetic, not a geographically accurate map.
A map-journey story is usually paced around narrative stops with descriptive copy at each waypoint. This snippet is deliberately framed as live telemetry instrumentation — dark console UI, numeric readouts, dotted guide paths — meant to feel like monitoring a system in real time rather than reading a travel narrative.