You Might Also Like
Learn Coding Visually
Learn to code with interactive, live-preview playgrounds — HTML, CSS, JavaScript, React & more.
 HTML Playground42 lessons · Click-based · Live preview
 CSS PlaygroundLearn CSS with a live editor
 JavaScript Playground60 lessons · DOM · Async · Canvas
 React PlaygroundLearn React with a live code editor
 GSAP PlaygroundLearn GSAP animation interactively
 SVG Playground44 lessons · shapes · paths · animation
 SCSS Playground45 lessons · Sass modules · tokens
 Tailwind PlaygroundLearn Tailwind CSS with a live editor
 Bootstrap 5 Playground50 lessons · live preview
Scroll-Driven Line Chart Draw — Free Scrubbed SVG Data Viz
Scroll-Driven Line Chart Draw · Scroll · Plain HTML, CSS & JS · Live preview
What's included
Features
About this UI Snippet
Scroll-Driven Line Chart Draw — A Data Line That Draws in With Scroll
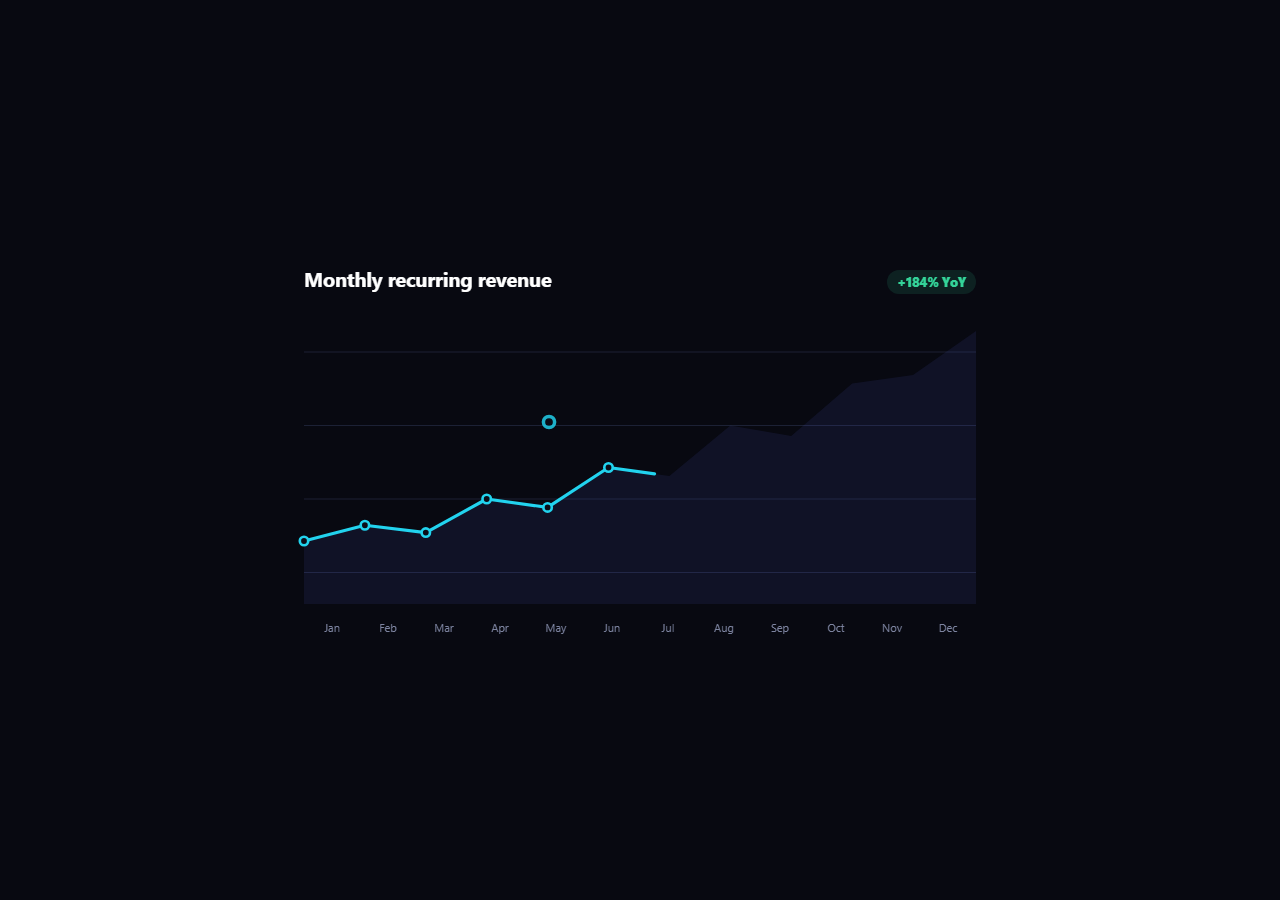
Generic scroll-triggered SVG line draws are common; this one is built specifically for data visualization. A monthly revenue line chart — real x/y points, an area fill, per-point dots, and value labels — draws itself in as you scroll, with every part of the reveal tied to the same scroll-scrubbed progress value via GSAP and ScrollTrigger loaded from a CDN.
Scrubbed, not just triggered
The ScrollTrigger uses scrub: 0.4 rather than toggleActions, which means the timeline's playhead is bound to scroll position for the whole 280vh wrapper, not just kicked off once when it enters view. Scroll a third of the way through the wrapper and the line is drawn a third of the way; scroll back and it un-draws by the same amount — this is what separates a genuine data-viz "reveal as you read" effect from a one-shot animation that merely starts on scroll.
stroke-dashoffset for the draw
The line's length is measured once with getTotalLength(), then stroke-dasharray is set to that length and stroke-dashoffset starts equal to it — fully hidden. Animating strokeDashoffset to 0 reveals the stroke from start to end, the standard SVG line-draw technique, here driven by the scrub timeline instead of a fixed duration.
One timeline, four synchronized layers
The same timeline also fades in the area fill beneath the line, pops each data-point dot with a slight overshoot scale as the draw reaches it, and reveals each month's value label — all positioned along the timeline with small offsets (stagger: 0.075) so dots and labels appear to catch up with the drawing line rather than all firing at the section's entrance. Because it's one timeline scrubbed by one ScrollTrigger, every layer stays perfectly synced at any scroll position, including mid-scrub.
Sticky panel, not pinned by JS
The chart panel uses CSS position: sticky inside the tall wrapper rather than ScrollTrigger's pin option, which keeps the implementation simpler and avoids the layout-shift ScrollTrigger's pin-spacer sometimes introduces — the wrapper's height alone provides the scroll distance the scrub timeline maps to.
Customizing it
Swap in your own data points and month labels, add a second line for a comparison series, or change scrub to a larger number like 1 for a slight catch-up lag instead of an exact 1:1 tie to scroll. Pair it with a scrollytelling chart, a scroll SVG path draw, or an always-live realtime line chart.
Build with AI
Build, Understand, Optimize, and Extend It With AI
Paste this snippet's HTML, CSS, and JS into an AI coding assistant like Claude and ask it to explain how scrub: 0.4 on the ScrollTrigger config changes the animation from a one-time triggered reveal into a continuous function of scroll position, and why putting the line draw, area fade, dot pops, and label reveals all on one shared GSAP timeline (rather than four separate ScrollTriggers) is what keeps them perfectly synchronized at any scroll offset, including while scrubbing backward. It's also useful for adapting the chart to real data: ask it to generate the path d attribute and dot coordinates programmatically from a JavaScript array of values instead of hardcoded SVG coordinates, or to add a second comparison line series drawn on a slight time offset from the first.
Prompt to recreate it
Copy this into your AI assistant of choice to build the effect from scratch, or as a jumping-off point for your own variant:
Build a "scroll-driven line chart draw" effect in plain HTML, CSS, and JavaScript using GSAP with its ScrollTrigger plugin (load both from a CDN).

Requirements:
- An SVG line chart with a real multi-point data series (e.g. 10-12 months of revenue values) rendered as an SVG path, plus a filled area path beneath it, a small circle dot at each data point, and text labels showing each point's value.
- Use the stroke-dashoffset SVG line-draw technique: measure the line path's total length with getTotalLength(), set stroke-dasharray to that length, set the initial stroke-dashoffset to the same length so the line starts fully hidden, then animate stroke-dashoffset toward 0 to reveal it.
- Wrap the line-draw animation, the area fill's opacity, each dot's opacity/scale pop, and each value label's reveal all inside a single GSAP timeline, with the dots and labels staggered by a small time offset (e.g. 0.075 per item) so they appear to catch up with the drawing line rather than all firing at once.
- Attach that single timeline to one ScrollTrigger using scrub (a numeric value like 0.4, not scrub: true, for a very slight smoothing lag) so the timeline's playhead position is a direct function of scroll position across a tall wrapper section — not a one-time triggered animation. Confirm this by scrubbing up and down: the line should draw and un-draw precisely in step with scroll position at any point, not just play once on entry.
- Put the chart panel inside a tall wrapper section (e.g. 250-300vh) with the panel itself using CSS position: sticky so it stays pinned in the viewport while the wrapper provides scroll distance for the scrub timeline to map to — do not use ScrollTrigger's pin option for this.
- Ensure scrolling back up un-draws the line, fades the area back out, and hides dots/labels in the exact reverse order, since the animation is a pure function of the shared scrub-driven timeline position.
Want to tighten it up first? Run this prompt through the AI Prompt Studio to score it across 8 quality dimensions, catch anti-patterns, and tune the wording for Claude, ChatGPT, or Gemini before you paste it in.
Step by step
How to Use
- 1Add the GSAP CDNsInclude gsap and ScrollTrigger from the CDN panel.
- 2Paste HTML, CSS, and JSAn intro, a sticky chart panel, and an outro render.
- 3Scroll through the chart sectionThe line draws, the area fills, dots and labels appear.
- 4Scrub slowly up and downThe draw progress tracks scroll position exactly, both ways.
- 5Swap in your dataEdit the path d attribute, dot cx/cy, and label text/data-v.
- 6Tune the scrub feelRaise scrub for lag, lower it for a tighter scroll tie.
Real-world uses
Common Use Cases
Got questions?
Frequently Asked Questions
The ScrollTrigger uses scrub: 0.4 instead of a toggleActions play-once trigger, which binds the timeline's playhead directly to scroll position across the whole wrapper height. Scrolling a third of the way through the section draws the line a third of the way; scrolling back un-draws it by the same amount — the draw amount is a genuine function of scroll position, verifiable by scrubbing.
The path's total length is measured once with getTotalLength(). stroke-dasharray is set to that length (creating one dash the length of the whole line and one equally long gap), and stroke-dashoffset starts at the same value, which shifts the dash fully out of view. Animating stroke-dashoffset down to 0 reveals the stroke progressively from its start point to its end point.
Putting the area fade, dot pops, and label reveals on the same GSAP timeline as the line draw, each positioned with a small time offset, means they all read from the identical scrub-driven playhead position. That guarantees they stay in sync at any scroll position — including mid-scroll or scrolling backward — rather than risking drift if they were driven by separate, independently-timed triggers.
Yes — replace the path's d attribute coordinates, the cx/cy on each .lc-dot circle, and the text/data-v attributes in .lc-labels with your own values scaled to the SVG's 640x280 viewBox. The stroke-dashoffset draw technique works with any path shape since getTotalLength measures whatever path is present.
Render the SVG with refs on the path elements, then in a mount effect register ScrollTrigger, measure getTotalLength on the line ref, and build the same scrubbed timeline scoped with gsap.context to a container ref. Return a cleanup that reverts the context so the ScrollTrigger instance and any timeline are removed on unmount.