Realtime Line Chart — Live SVG Chart HTML CSS JS

Realtime Line Chart · Charts · Plain HTML, CSS & JS · Live preview

Share & Support

What's included

Features

Sliding data window
A fixed-length array push/shifts each tick, so the chart streams forward in time like a real live monitor.
Auto-scaling Y axis
render rescales to the visible window's min/max (with a flat-line guard) so the line always uses the full height.
Single SVG path
The line is one M…L… <path> rebuilt per tick — cheap to draw and trivial to feed from any data source.
SVG gradient area
The area fills with an in-markup linearGradient, so it renders identically across HTML, React, Vue, and Tailwind exports.
Pulsing latest point
A transform-box: fill-box pulse circle rings the newest value, with a solid dot marking it precisely.
Live value + delta
The header shows the current reading and a coloured ▲/▼ change versus the previous tick for instant trend reading.
Running peak
A peak counter tracks the highest value seen, a common companion stat on live dashboards.
Fluid sizing
preserveAspectRatio="none" stretches the viewBox to the card width, so the chart is responsive with no JS resize handling.

About this UI Snippet

Realtime Line Chart — Streaming SVG Path, Auto-Scaling Axis & Pulsing Latest Point
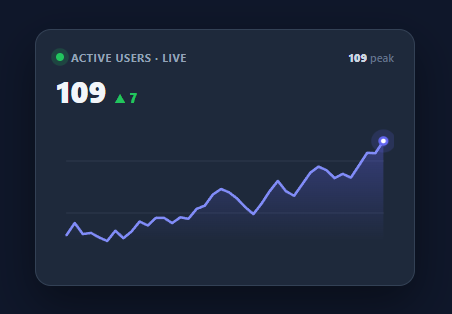
Screenshot of the Realtime Line Chart snippet rendered live

Live dashboards need charts that move — active users, requests per second, temperature, price. A realtime line chart streams in new data points, drops the oldest, and rescales so the trend is always readable. This snippet implements one in plain HTML, CSS, and vanilla JavaScript with an SVG path: a sliding window of points, an auto-scaling Y axis, a gradient area fill, a pulsing dot on the latest value, and a live readout with an up/down delta.

A sliding data window

The chart keeps a fixed-length array of COUNT values. On each tick, it pushes a new value (a clamped random walk standing in for live data) and shifts off the oldest, so the window slides forward in time. render then maps that array to SVG coordinates and rewrites the path — the classic streaming-chart loop. Driving updates from JavaScript (a setInterval here, your websocket or polling fetch in production) means there is no fragile CSS animation of path data; the chart simply redraws each tick.

Auto-scaling Y axis

Real metrics drift, so a fixed scale wastes space or clips. render computes the current min and max of the visible window and maps each value into the plot area between them, with a guard so a flat line (max ≈ min) doesn't divide by zero. The line always uses the full vertical space, keeping small fluctuations visible — the behaviour you want from a live monitor.

SVG path and gradient area

The line is a single <path> built as M x y L x y … from the points; the area is the same path closed down to the baseline and filled with an SVG linearGradient (defined in <defs>). Using an SVG gradient — rather than a CSS background — means the fill is part of the markup and survives every framework export untouched, sidestepping the CSS-gradient conversion quirks of utility frameworks. preserveAspectRatio="none" lets the 320×140 viewBox stretch fluidly to the card width.

Pulsing latest point and live readout

Two circles sit on the most recent point: a solid dot and a .rt-pulse that scales and fades on a CSS loop (using transform-box: fill-box so the SVG transform-origin is the circle's own centre). The header shows the current value and a coloured ▲/▼ delta versus the previous tick, plus a running peak — the at-a-glance numbers that accompany any live chart, with a "live" indicator dot pulsing beside the label.

Swap the random walk in step for your real feed and you have a production monitor. Pair this with a sparkline chart for compact trends, a bar chart for categories, or a metric card grid for KPIs.

Step by step

How to Use

  1. 1
    Paste HTML, CSS, and JSA dark dashboard card appears with a live line chart that updates every ~1.1 seconds, sliding new points in from the right.
  2. 2
    Watch it streamEach tick adds a value and drops the oldest; the gradient area and line redraw, and the pulsing dot rides the latest point.
  3. 3
    Read the live numbersThe big value shows the current reading with a green ▲ or red ▼ delta versus the previous tick, plus a running peak.
  4. 4
    See the auto-scalingAs values drift, the chart rescales so the line always fills the vertical space — small changes stay visible.
  5. 5
    Connect real dataReplace the random walk in step with values from a websocket or polling fetch and push them in tick.
  6. 6
    Tune the windowChange COUNT for a longer/shorter history and the setInterval delay for a faster/slower stream.

Real-world uses

Common Use Cases

Live analytics dashboards
Active users, sessions, or events per second. Sit it beside a metric card grid and bar chart.
System and server monitoring
CPU, memory, request rate, or latency streams where auto-scaling keeps spikes readable.
Trading and price tickers
Live price or volume feeds; pair the delta readout with a sparkline chart for a compact watchlist.
IoT and sensor readouts
Temperature, humidity, or power draw from a device, updated over a websocket into tick.
Realtime gaming / app stats
Concurrent players or live engagement counts, with the pulsing dot reinforcing that the data is live.
Status and uptime pages
Live throughput on a status dashboard, giving visitors confidence the system is healthy.

Got questions?

Frequently Asked Questions

Remove the random step call in tick and instead push values from your source: subscribe to a websocket and call a push(value) that does data.push(value); data.shift(); render(), or poll an endpoint on an interval. Keep the array length fixed so the window keeps sliding. render handles scaling and drawing regardless of where the numbers come from.

Build the path with cubic Béziers instead of straight L segments: for each point, use control points derived from its neighbours (Catmull-Rom to Bézier) so the curve flows smoothly. Alternatively, animate the whole path group's translateX by one step per tick with a CSS transform transition, then reset — giving a continuous scrolling motion rather than discrete jumps.

The area fill is part of the SVG (fill: url(#rtGrad) with a <linearGradient> in <defs>), so it renders identically everywhere and is not subject to CSS-to-utility conversion quirks. It also clips perfectly to the area path shape, which a CSS background on a rectangular element cannot do.

An animated SVG line is not screen-reader friendly on its own, so expose the data textually: the live value and delta are already real text, and you can add an aria-live="polite" region announcing the current reading on a throttled cadence (not every tick). Provide an accessible summary or data table for the full series, and give the SVG a role="img" with an aria-label.

In React, keep the data array in a ref and the displayed value in state, run the interval in a useEffect with a cleanup that calls clearInterval, and compute the path with useMemo from the data. In Vue, use onMounted/onUnmounted for the interval and a computed path. In Angular, start/stop the interval in ngOnInit/ngOnDestroy. The path-building and scaling math port unchanged.

Realtime Line Chart — Export as HTML, React, Vue, Angular & Tailwind

HTML
<!DOCTYPE html>
<html lang="en">
<head>
  <meta charset="UTF-8" />
  <meta name="viewport" content="width=device-width, initial-scale=1.0" />
  <title>Realtime Line Chart</title>
  <style>
    *{box-sizing:border-box;margin:0;padding:0}
    body{font-family:system-ui,-apple-system,sans-serif;background:#0f172a;min-height:100vh;display:flex;align-items:center;justify-content:center;padding:24px}
    .rt-card{background:#1e293b;border:1px solid #334155;border-radius:16px;padding:20px;width:100%;max-width:380px;box-shadow:0 18px 44px rgba(0,0,0,.4)}
    .rt-head{display:flex;align-items:flex-start;justify-content:space-between;margin-bottom:14px}
    .rt-label{display:flex;align-items:center;gap:7px;font-size:11px;font-weight:700;color:#94a3b8;text-transform:uppercase;letter-spacing:.05em}
    .rt-live{width:8px;height:8px;border-radius:50%;background:#22c55e;position:relative}
    .rt-live::after{content:'';position:absolute;inset:0;border-radius:50%;background:#22c55e;animation:rt-ping 1.6s ease-out infinite}
    @keyframes rt-ping{0%{transform:scale(1);opacity:.7}100%{transform:scale(2.6);opacity:0}}
    .rt-value{display:flex;align-items:baseline;gap:8px;margin-top:6px}
    .rt-value #rtNow{font-size:30px;font-weight:800;color:#f1f5f9;font-variant-numeric:tabular-nums}
    .rt-delta{font-size:13px;font-weight:800;font-variant-numeric:tabular-nums}
    .rt-delta.up{color:#22c55e}
    .rt-delta.down{color:#f87171}
    .rt-range{font-size:11px;color:#64748b;font-weight:600}
    .rt-range span{color:#cbd5e1;font-weight:800}
    
    .rt-svg{width:100%;height:140px;display:block}
    .rt-grid{stroke:rgba(148,163,184,.14);stroke-width:1}
    .rt-area{fill:url(#rtGrad)}
    .rt-stroke{fill:none;stroke:#818cf8;stroke-width:2.5;stroke-linejoin:round;stroke-linecap:round}
    .rt-dot{fill:#fff;stroke:#6366f1;stroke-width:2.5}
    .rt-pulse{fill:#6366f1;transform-box:fill-box;transform-origin:center;animation:rt-dotping 1.6s ease-out infinite}
    @keyframes rt-dotping{0%{transform:scale(.6);opacity:.6}100%{transform:scale(2.4);opacity:0}}
  </style>
</head>
<body>
  <div class="rt-card">
    <div class="rt-head">
      <div>
        <div class="rt-label"><span class="rt-live"></span>Active users · live</div>
        <div class="rt-value"><span id="rtNow">0</span><span class="rt-delta" id="rtDelta"></span></div>
      </div>
      <div class="rt-range"><span id="rtMax">0</span> peak</div>
    </div>
  
    <svg class="rt-svg" viewBox="0 0 320 140" preserveAspectRatio="none">
      <defs>
        <linearGradient id="rtGrad" x1="0" y1="0" x2="0" y2="1">
          <stop offset="0%" stop-color="#6366f1" stop-opacity="0.35"/>
          <stop offset="100%" stop-color="#6366f1" stop-opacity="0"/>
        </linearGradient>
      </defs>
      <line class="rt-grid" x1="10" y1="36" x2="310" y2="36"/>
      <line class="rt-grid" x1="10" y1="88" x2="310" y2="88"/>
      <path id="rtArea" class="rt-area" d=""/>
      <path id="rtLine" class="rt-stroke" d=""/>
      <circle id="rtDotPulse" class="rt-pulse" r="6"/>
      <circle id="rtDot" class="rt-dot" r="3.5"/>
    </svg>
  </div>
  <script>
    var COUNT = 40;
    var X0 = 10, X1 = 310, TOP = 16, BOT = 116;
    var line, area, dot, dotPulse, nowEl, deltaEl, maxEl;
    var data = [];
    var v = 60;
    var peak = 0;
    
    function step(val) {
      val += (Math.random() - 0.48) * 14;
      return Math.max(20, Math.min(160, val));
    }
    
    function render() {
      var min = Math.min.apply(null, data);
      var max = Math.max.apply(null, data);
      if (max - min < 1) max = min + 1;
      var stepX = (X1 - X0) / (COUNT - 1);
      var pts = data.map(function (d, i) {
        var x = X0 + i * stepX;
        var y = BOT - ((d - min) / (max - min)) * (BOT - TOP);
        return [x, y];
      });
      var dLine = 'M ' + pts.map(function (p) { return p[0].toFixed(1) + ' ' + p[1].toFixed(1); }).join(' L ');
      line.setAttribute('d', dLine);
      area.setAttribute('d', dLine + ' L ' + X1 + ' ' + BOT + ' L ' + X0 + ' ' + BOT + ' Z');
    
      var last = pts[pts.length - 1];
      dot.setAttribute('cx', last[0]); dot.setAttribute('cy', last[1]);
      dotPulse.setAttribute('cx', last[0]); dotPulse.setAttribute('cy', last[1]);
    
      var cur = Math.round(data[data.length - 1]);
      var prev = Math.round(data[data.length - 2]);
      nowEl.textContent = cur;
      var diff = cur - prev;
      deltaEl.textContent = (diff >= 0 ? '▲ ' : '▼ ') + Math.abs(diff);
      deltaEl.className = 'rt-delta ' + (diff >= 0 ? 'up' : 'down');
      peak = Math.max(peak, cur);
      maxEl.textContent = peak;
    }
    
    function tick() {
      data.push(step(data[data.length - 1]));
      data.shift();
      render();
    }
    
    function init() {
      line = document.getElementById('rtLine');
      area = document.getElementById('rtArea');
      dot = document.getElementById('rtDot');
      dotPulse = document.getElementById('rtDotPulse');
      nowEl = document.getElementById('rtNow');
      deltaEl = document.getElementById('rtDelta');
      maxEl = document.getElementById('rtMax');
      for (var i = 0; i < COUNT; i++) { v = step(v); data.push(v); }
      render();
      setInterval(tick, 1100);
    }
    init();
  </script>
</body>
</html>
Tailwind
<!DOCTYPE html>
<html lang="en">
<head>
  <meta charset="UTF-8" />
  <meta name="viewport" content="width=device-width, initial-scale=1.0" />
  <title>Realtime Line Chart</title>
  <!-- Tailwind CSS v3+ — arbitrary value classes (e.g. bg-[#0f172a]) are valid -->
  <script src="https://cdn.tailwindcss.com"></script>
  <style>
    @keyframes rt-ping{0%{transform:scale(1);opacity:.7}100%{transform:scale(2.6);opacity:0}}

    @keyframes rt-dotping{0%{transform:scale(.6);opacity:.6}100%{transform:scale(2.4);opacity:0}}

    * {
      box-sizing:border-box;margin:0;padding:0
    }

    body {
      font-family:system-ui,-apple-system,sans-serif;background:#0f172a;min-height:100vh;display:flex;align-items:center;justify-content:center;padding:24px
    }

    .rt-live::after {
      content:'';position:absolute;inset:0;border-radius:50%;background:#22c55e;animation:rt-ping 1.6s ease-out infinite
    }

    .rt-value #rtNow {
      font-size:30px;font-weight:800;color:#f1f5f9;font-variant-numeric:tabular-nums
    }

    .rt-delta {
      font-size:13px;font-weight:800;font-variant-numeric:tabular-nums
    }

    .rt-delta.up {
      color:#22c55e
    }

    .rt-delta.down {
      color:#f87171
    }

    .rt-range span {
      color:#cbd5e1;font-weight:800
    }
  </style>
</head>
<body>
  <div class="bg-[#1e293b] border border-[#334155] rounded-2xl p-5 w-full max-w-[380px] shadow-[0_18px_44px_rgba(0,0,0,.4)]">
    <div class="flex items-start justify-between mb-3.5">
      <div>
        <div class="flex items-center gap-[7px] text-[11px] font-bold text-[#94a3b8] uppercase tracking-[.05em]"><span class="rt-live w-2 h-2 rounded-full bg-[#22c55e] relative"></span>Active users · live</div>
        <div class="rt-value flex items-baseline gap-2 mt-1.5"><span id="rtNow">0</span><span class="rt-delta" id="rtDelta"></span></div>
      </div>
      <div class="rt-range text-[11px] text-[#64748b] font-semibold"><span id="rtMax">0</span> peak</div>
    </div>
  
    <svg class="w-full h-[140px] block" viewBox="0 0 320 140" preserveAspectRatio="none">
      <defs>
        <linearGradient id="rtGrad" x1="0" y1="0" x2="0" y2="1">
          <stop offset="0%" stop-color="#6366f1" stop-opacity="0.35"/>
          <stop offset="100%" stop-color="#6366f1" stop-opacity="0"/>
        </linearGradient>
      </defs>
      <line class="stroke-[rgba(148,163,184,.14)] [stroke-width:1]" x1="10" y1="36" x2="310" y2="36"/>
      <line class="stroke-[rgba(148,163,184,.14)] [stroke-width:1]" x1="10" y1="88" x2="310" y2="88"/>
      <path id="rtArea" class="fill-[url(#rtGrad)]" d=""/>
      <path id="rtLine" class="fill-none stroke-[#818cf8] [stroke-width:2.5] [stroke-linejoin:round] [stroke-linecap:round]" d=""/>
      <circle id="rtDotPulse" class="fill-[#6366f1] [transform-box:fill-box] [transform-origin:center] [animation:rt-dotping_1.6s_ease-out_infinite]" r="6"/>
      <circle id="rtDot" class="fill-[#fff] stroke-[#6366f1] [stroke-width:2.5]" r="3.5"/>
    </svg>
  </div>
  <script>
    var COUNT = 40;
    var X0 = 10, X1 = 310, TOP = 16, BOT = 116;
    var line, area, dot, dotPulse, nowEl, deltaEl, maxEl;
    var data = [];
    var v = 60;
    var peak = 0;
    
    function step(val) {
      val += (Math.random() - 0.48) * 14;
      return Math.max(20, Math.min(160, val));
    }
    
    function render() {
      var min = Math.min.apply(null, data);
      var max = Math.max.apply(null, data);
      if (max - min < 1) max = min + 1;
      var stepX = (X1 - X0) / (COUNT - 1);
      var pts = data.map(function (d, i) {
        var x = X0 + i * stepX;
        var y = BOT - ((d - min) / (max - min)) * (BOT - TOP);
        return [x, y];
      });
      var dLine = 'M ' + pts.map(function (p) { return p[0].toFixed(1) + ' ' + p[1].toFixed(1); }).join(' L ');
      line.setAttribute('d', dLine);
      area.setAttribute('d', dLine + ' L ' + X1 + ' ' + BOT + ' L ' + X0 + ' ' + BOT + ' Z');
    
      var last = pts[pts.length - 1];
      dot.setAttribute('cx', last[0]); dot.setAttribute('cy', last[1]);
      dotPulse.setAttribute('cx', last[0]); dotPulse.setAttribute('cy', last[1]);
    
      var cur = Math.round(data[data.length - 1]);
      var prev = Math.round(data[data.length - 2]);
      nowEl.textContent = cur;
      var diff = cur - prev;
      deltaEl.textContent = (diff >= 0 ? '▲ ' : '▼ ') + Math.abs(diff);
      deltaEl.className = 'rt-delta ' + (diff >= 0 ? 'up' : 'down');
      peak = Math.max(peak, cur);
      maxEl.textContent = peak;
    }
    
    function tick() {
      data.push(step(data[data.length - 1]));
      data.shift();
      render();
    }
    
    function init() {
      line = document.getElementById('rtLine');
      area = document.getElementById('rtArea');
      dot = document.getElementById('rtDot');
      dotPulse = document.getElementById('rtDotPulse');
      nowEl = document.getElementById('rtNow');
      deltaEl = document.getElementById('rtDelta');
      maxEl = document.getElementById('rtMax');
      for (var i = 0; i < COUNT; i++) { v = step(v); data.push(v); }
      render();
      setInterval(tick, 1100);
    }
    init();
  </script>
</body>
</html>
React
import React, { useEffect } from 'react';

// CSS — optionally move to RealtimeLineChart.module.css
const css = `
*{box-sizing:border-box;margin:0;padding:0}
body{font-family:system-ui,-apple-system,sans-serif;background:#0f172a;min-height:100vh;display:flex;align-items:center;justify-content:center;padding:24px}
.rt-card{background:#1e293b;border:1px solid #334155;border-radius:16px;padding:20px;width:100%;max-width:380px;box-shadow:0 18px 44px rgba(0,0,0,.4)}
.rt-head{display:flex;align-items:flex-start;justify-content:space-between;margin-bottom:14px}
.rt-label{display:flex;align-items:center;gap:7px;font-size:11px;font-weight:700;color:#94a3b8;text-transform:uppercase;letter-spacing:.05em}
.rt-live{width:8px;height:8px;border-radius:50%;background:#22c55e;position:relative}
.rt-live::after{content:'';position:absolute;inset:0;border-radius:50%;background:#22c55e;animation:rt-ping 1.6s ease-out infinite}
@keyframes rt-ping{0%{transform:scale(1);opacity:.7}100%{transform:scale(2.6);opacity:0}}
.rt-value{display:flex;align-items:baseline;gap:8px;margin-top:6px}
.rt-value #rtNow{font-size:30px;font-weight:800;color:#f1f5f9;font-variant-numeric:tabular-nums}
.rt-delta{font-size:13px;font-weight:800;font-variant-numeric:tabular-nums}
.rt-delta.up{color:#22c55e}
.rt-delta.down{color:#f87171}
.rt-range{font-size:11px;color:#64748b;font-weight:600}
.rt-range span{color:#cbd5e1;font-weight:800}

.rt-svg{width:100%;height:140px;display:block}
.rt-grid{stroke:rgba(148,163,184,.14);stroke-width:1}
.rt-area{fill:url(#rtGrad)}
.rt-stroke{fill:none;stroke:#818cf8;stroke-width:2.5;stroke-linejoin:round;stroke-linecap:round}
.rt-dot{fill:#fff;stroke:#6366f1;stroke-width:2.5}
.rt-pulse{fill:#6366f1;transform-box:fill-box;transform-origin:center;animation:rt-dotping 1.6s ease-out infinite}
@keyframes rt-dotping{0%{transform:scale(.6);opacity:.6}100%{transform:scale(2.4);opacity:0}}
`;

export default function RealtimeLineChart() {
  // Auto-generated escape hatch: the original snippet's vanilla JS runs once
  // after mount and queries the rendered DOM. For idiomatic React, lift this
  // into state + handlers.
  useEffect(() => {
    const _listeners = [];
    const _originalAddEventListener = EventTarget.prototype.addEventListener;
    EventTarget.prototype.addEventListener = function(type, listener, options) {
      _listeners.push({ target: this, type, listener, options });
      return _originalAddEventListener.call(this, type, listener, options);
    };
    var COUNT = 40;
    var X0 = 10, X1 = 310, TOP = 16, BOT = 116;
    var line, area, dot, dotPulse, nowEl, deltaEl, maxEl;
    var data = [];
    var v = 60;
    var peak = 0;
    
    function step(val) {
      val += (Math.random() - 0.48) * 14;
      return Math.max(20, Math.min(160, val));
    }
    
    function render() {
      var min = Math.min.apply(null, data);
      var max = Math.max.apply(null, data);
      if (max - min < 1) max = min + 1;
      var stepX = (X1 - X0) / (COUNT - 1);
      var pts = data.map(function (d, i) {
        var x = X0 + i * stepX;
        var y = BOT - ((d - min) / (max - min)) * (BOT - TOP);
        return [x, y];
      });
      var dLine = 'M ' + pts.map(function (p) { return p[0].toFixed(1) + ' ' + p[1].toFixed(1); }).join(' L ');
      line.setAttribute('d', dLine);
      area.setAttribute('d', dLine + ' L ' + X1 + ' ' + BOT + ' L ' + X0 + ' ' + BOT + ' Z');
    
      var last = pts[pts.length - 1];
      dot.setAttribute('cx', last[0]); dot.setAttribute('cy', last[1]);
      dotPulse.setAttribute('cx', last[0]); dotPulse.setAttribute('cy', last[1]);
    
      var cur = Math.round(data[data.length - 1]);
      var prev = Math.round(data[data.length - 2]);
      nowEl.textContent = cur;
      var diff = cur - prev;
      deltaEl.textContent = (diff >= 0 ? '▲ ' : '▼ ') + Math.abs(diff);
      deltaEl.className = 'rt-delta ' + (diff >= 0 ? 'up' : 'down');
      peak = Math.max(peak, cur);
      maxEl.textContent = peak;
    }
    
    function tick() {
      data.push(step(data[data.length - 1]));
      data.shift();
      render();
    }
    
    function init() {
      line = document.getElementById('rtLine');
      area = document.getElementById('rtArea');
      dot = document.getElementById('rtDot');
      dotPulse = document.getElementById('rtDotPulse');
      nowEl = document.getElementById('rtNow');
      deltaEl = document.getElementById('rtDelta');
      maxEl = document.getElementById('rtMax');
      for (var i = 0; i < COUNT; i++) { v = step(v); data.push(v); }
      render();
      setInterval(tick, 1100);
    }
    init();
    // Cleanup: restore addEventListener and remove all listeners
    return () => {
      EventTarget.prototype.addEventListener = _originalAddEventListener;
      for (const { target, type, listener, options } of _listeners) {
        target.removeEventListener(type, listener, options);
      }
    };
  }, []);

  return (
    <>
      <style>{css}</style>
      <div className="rt-card">
        <div className="rt-head">
          <div>
            <div className="rt-label"><span className="rt-live"></span>Active users · live</div>
            <div className="rt-value"><span id="rtNow">0</span><span className="rt-delta" id="rtDelta"></span></div>
          </div>
          <div className="rt-range"><span id="rtMax">0</span> peak</div>
        </div>
      
        <svg className="rt-svg" viewBox="0 0 320 140" preserveAspectRatio="none">
          <defs>
            <linearGradient id="rtGrad" x1="0" y1="0" x2="0" y2="1">
              <stop offset="0%" stop-color="#6366f1" stop-opacity="0.35"/>
              <stop offset="100%" stop-color="#6366f1" stop-opacity="0"/>
            </linearGradient>
          </defs>
          <line className="rt-grid" x1="10" y1="36" x2="310" y2="36"/>
          <line className="rt-grid" x1="10" y1="88" x2="310" y2="88"/>
          <path id="rtArea" className="rt-area" d=""/>
          <path id="rtLine" className="rt-stroke" d=""/>
          <circle id="rtDotPulse" className="rt-pulse" r="6"/>
          <circle id="rtDot" className="rt-dot" r="3.5"/>
        </svg>
      </div>
    </>
  );
}
React + Tailwind
import React, { useEffect } from 'react';
// Requires Tailwind CSS v3+ — https://tailwindcss.com/docs/installation
// Arbitrary value classes (e.g. bg-[#0f172a]) are valid Tailwind v3+

export default function RealtimeLineChart() {
  // Auto-generated escape hatch: the original snippet's vanilla JS runs once
  // after mount and queries the rendered DOM. For idiomatic React, lift this
  // into state + handlers.
  useEffect(() => {
    const _listeners = [];
    const _originalAddEventListener = EventTarget.prototype.addEventListener;
    EventTarget.prototype.addEventListener = function(type, listener, options) {
      _listeners.push({ target: this, type, listener, options });
      return _originalAddEventListener.call(this, type, listener, options);
    };
    var COUNT = 40;
    var X0 = 10, X1 = 310, TOP = 16, BOT = 116;
    var line, area, dot, dotPulse, nowEl, deltaEl, maxEl;
    var data = [];
    var v = 60;
    var peak = 0;
    
    function step(val) {
      val += (Math.random() - 0.48) * 14;
      return Math.max(20, Math.min(160, val));
    }
    
    function render() {
      var min = Math.min.apply(null, data);
      var max = Math.max.apply(null, data);
      if (max - min < 1) max = min + 1;
      var stepX = (X1 - X0) / (COUNT - 1);
      var pts = data.map(function (d, i) {
        var x = X0 + i * stepX;
        var y = BOT - ((d - min) / (max - min)) * (BOT - TOP);
        return [x, y];
      });
      var dLine = 'M ' + pts.map(function (p) { return p[0].toFixed(1) + ' ' + p[1].toFixed(1); }).join(' L ');
      line.setAttribute('d', dLine);
      area.setAttribute('d', dLine + ' L ' + X1 + ' ' + BOT + ' L ' + X0 + ' ' + BOT + ' Z');
    
      var last = pts[pts.length - 1];
      dot.setAttribute('cx', last[0]); dot.setAttribute('cy', last[1]);
      dotPulse.setAttribute('cx', last[0]); dotPulse.setAttribute('cy', last[1]);
    
      var cur = Math.round(data[data.length - 1]);
      var prev = Math.round(data[data.length - 2]);
      nowEl.textContent = cur;
      var diff = cur - prev;
      deltaEl.textContent = (diff >= 0 ? '▲ ' : '▼ ') + Math.abs(diff);
      deltaEl.className = 'rt-delta ' + (diff >= 0 ? 'up' : 'down');
      peak = Math.max(peak, cur);
      maxEl.textContent = peak;
    }
    
    function tick() {
      data.push(step(data[data.length - 1]));
      data.shift();
      render();
    }
    
    function init() {
      line = document.getElementById('rtLine');
      area = document.getElementById('rtArea');
      dot = document.getElementById('rtDot');
      dotPulse = document.getElementById('rtDotPulse');
      nowEl = document.getElementById('rtNow');
      deltaEl = document.getElementById('rtDelta');
      maxEl = document.getElementById('rtMax');
      for (var i = 0; i < COUNT; i++) { v = step(v); data.push(v); }
      render();
      setInterval(tick, 1100);
    }
    init();
    // Cleanup: restore addEventListener and remove all listeners
    return () => {
      EventTarget.prototype.addEventListener = _originalAddEventListener;
      for (const { target, type, listener, options } of _listeners) {
        target.removeEventListener(type, listener, options);
      }
    };
  }, []);

  return (
    <>
      <style>{`
@keyframes rt-ping{0%{transform:scale(1);opacity:.7}100%{transform:scale(2.6);opacity:0}}

@keyframes rt-dotping{0%{transform:scale(.6);opacity:.6}100%{transform:scale(2.4);opacity:0}}

* {
  box-sizing:border-box;margin:0;padding:0
}

body {
  font-family:system-ui,-apple-system,sans-serif;background:#0f172a;min-height:100vh;display:flex;align-items:center;justify-content:center;padding:24px
}

.rt-live::after {
  content:'';position:absolute;inset:0;border-radius:50%;background:#22c55e;animation:rt-ping 1.6s ease-out infinite
}

.rt-value #rtNow {
  font-size:30px;font-weight:800;color:#f1f5f9;font-variant-numeric:tabular-nums
}

.rt-delta {
  font-size:13px;font-weight:800;font-variant-numeric:tabular-nums
}

.rt-delta.up {
  color:#22c55e
}

.rt-delta.down {
  color:#f87171
}

.rt-range span {
  color:#cbd5e1;font-weight:800
}
      `}</style>
      <div className="bg-[#1e293b] border border-[#334155] rounded-2xl p-5 w-full max-w-[380px] shadow-[0_18px_44px_rgba(0,0,0,.4)]">
        <div className="flex items-start justify-between mb-3.5">
          <div>
            <div className="flex items-center gap-[7px] text-[11px] font-bold text-[#94a3b8] uppercase tracking-[.05em]"><span className="rt-live w-2 h-2 rounded-full bg-[#22c55e] relative"></span>Active users · live</div>
            <div className="rt-value flex items-baseline gap-2 mt-1.5"><span id="rtNow">0</span><span className="rt-delta" id="rtDelta"></span></div>
          </div>
          <div className="rt-range text-[11px] text-[#64748b] font-semibold"><span id="rtMax">0</span> peak</div>
        </div>
      
        <svg className="w-full h-[140px] block" viewBox="0 0 320 140" preserveAspectRatio="none">
          <defs>
            <linearGradient id="rtGrad" x1="0" y1="0" x2="0" y2="1">
              <stop offset="0%" stop-color="#6366f1" stop-opacity="0.35"/>
              <stop offset="100%" stop-color="#6366f1" stop-opacity="0"/>
            </linearGradient>
          </defs>
          <line className="stroke-[rgba(148,163,184,.14)] [stroke-width:1]" x1="10" y1="36" x2="310" y2="36"/>
          <line className="stroke-[rgba(148,163,184,.14)] [stroke-width:1]" x1="10" y1="88" x2="310" y2="88"/>
          <path id="rtArea" className="fill-[url(#rtGrad)]" d=""/>
          <path id="rtLine" className="fill-none stroke-[#818cf8] [stroke-width:2.5] [stroke-linejoin:round] [stroke-linecap:round]" d=""/>
          <circle id="rtDotPulse" className="fill-[#6366f1] [transform-box:fill-box] [transform-origin:center] [animation:rt-dotping_1.6s_ease-out_infinite]" r="6"/>
          <circle id="rtDot" className="fill-[#fff] stroke-[#6366f1] [stroke-width:2.5]" r="3.5"/>
        </svg>
      </div>
    </>
  );
}
Vue
<template>
  <div class="rt-card">
    <div class="rt-head">
      <div>
        <div class="rt-label"><span class="rt-live"></span>Active users · live</div>
        <div class="rt-value"><span id="rtNow">0</span><span class="rt-delta" id="rtDelta"></span></div>
      </div>
      <div class="rt-range"><span id="rtMax">0</span> peak</div>
    </div>
  
    <svg class="rt-svg" viewBox="0 0 320 140" preserveAspectRatio="none">
      <defs>
        <linearGradient id="rtGrad" x1="0" y1="0" x2="0" y2="1">
          <stop offset="0%" stop-color="#6366f1" stop-opacity="0.35"/>
          <stop offset="100%" stop-color="#6366f1" stop-opacity="0"/>
        </linearGradient>
      </defs>
      <line class="rt-grid" x1="10" y1="36" x2="310" y2="36"/>
      <line class="rt-grid" x1="10" y1="88" x2="310" y2="88"/>
      <path id="rtArea" class="rt-area" d=""/>
      <path id="rtLine" class="rt-stroke" d=""/>
      <circle id="rtDotPulse" class="rt-pulse" r="6"/>
      <circle id="rtDot" class="rt-dot" r="3.5"/>
    </svg>
  </div>
</template>

<script setup>
import { onMounted } from 'vue';

var COUNT = 40;
var X0 = 10, X1 = 310, TOP = 16, BOT = 116;
var line, area, dot, dotPulse, nowEl, deltaEl, maxEl;
var data = [];
var v = 60;
var peak = 0;
function step(val) {
  val += (Math.random() - 0.48) * 14;
  return Math.max(20, Math.min(160, val));
}
function render() {
  var min = Math.min.apply(null, data);
  var max = Math.max.apply(null, data);
  if (max - min < 1) max = min + 1;
  var stepX = (X1 - X0) / (COUNT - 1);
  var pts = data.map(function (d, i) {
    var x = X0 + i * stepX;
    var y = BOT - ((d - min) / (max - min)) * (BOT - TOP);
    return [x, y];
  });
  var dLine = 'M ' + pts.map(function (p) { return p[0].toFixed(1) + ' ' + p[1].toFixed(1); }).join(' L ');
  line.setAttribute('d', dLine);
  area.setAttribute('d', dLine + ' L ' + X1 + ' ' + BOT + ' L ' + X0 + ' ' + BOT + ' Z');

  var last = pts[pts.length - 1];
  dot.setAttribute('cx', last[0]); dot.setAttribute('cy', last[1]);
  dotPulse.setAttribute('cx', last[0]); dotPulse.setAttribute('cy', last[1]);

  var cur = Math.round(data[data.length - 1]);
  var prev = Math.round(data[data.length - 2]);
  nowEl.textContent = cur;
  var diff = cur - prev;
  deltaEl.textContent = (diff >= 0 ? '▲ ' : '▼ ') + Math.abs(diff);
  deltaEl.className = 'rt-delta ' + (diff >= 0 ? 'up' : 'down');
  peak = Math.max(peak, cur);
  maxEl.textContent = peak;
}
function tick() {
  data.push(step(data[data.length - 1]));
  data.shift();
  render();
}
function init() {
  line = document.getElementById('rtLine');
  area = document.getElementById('rtArea');
  dot = document.getElementById('rtDot');
  dotPulse = document.getElementById('rtDotPulse');
  nowEl = document.getElementById('rtNow');
  deltaEl = document.getElementById('rtDelta');
  maxEl = document.getElementById('rtMax');
  for (var i = 0; i < COUNT; i++) { v = step(v); data.push(v); }
  render();
  setInterval(tick, 1100);
}

onMounted(() => {
  init();
});
</script>

<style scoped>
*{box-sizing:border-box;margin:0;padding:0}
body{font-family:system-ui,-apple-system,sans-serif;background:#0f172a;min-height:100vh;display:flex;align-items:center;justify-content:center;padding:24px}
.rt-card{background:#1e293b;border:1px solid #334155;border-radius:16px;padding:20px;width:100%;max-width:380px;box-shadow:0 18px 44px rgba(0,0,0,.4)}
.rt-head{display:flex;align-items:flex-start;justify-content:space-between;margin-bottom:14px}
.rt-label{display:flex;align-items:center;gap:7px;font-size:11px;font-weight:700;color:#94a3b8;text-transform:uppercase;letter-spacing:.05em}
.rt-live{width:8px;height:8px;border-radius:50%;background:#22c55e;position:relative}
.rt-live::after{content:'';position:absolute;inset:0;border-radius:50%;background:#22c55e;animation:rt-ping 1.6s ease-out infinite}
@keyframes rt-ping{0%{transform:scale(1);opacity:.7}100%{transform:scale(2.6);opacity:0}}
.rt-value{display:flex;align-items:baseline;gap:8px;margin-top:6px}
.rt-value #rtNow{font-size:30px;font-weight:800;color:#f1f5f9;font-variant-numeric:tabular-nums}
.rt-delta{font-size:13px;font-weight:800;font-variant-numeric:tabular-nums}
.rt-delta.up{color:#22c55e}
.rt-delta.down{color:#f87171}
.rt-range{font-size:11px;color:#64748b;font-weight:600}
.rt-range span{color:#cbd5e1;font-weight:800}

.rt-svg{width:100%;height:140px;display:block}
.rt-grid{stroke:rgba(148,163,184,.14);stroke-width:1}
.rt-area{fill:url(#rtGrad)}
.rt-stroke{fill:none;stroke:#818cf8;stroke-width:2.5;stroke-linejoin:round;stroke-linecap:round}
.rt-dot{fill:#fff;stroke:#6366f1;stroke-width:2.5}
.rt-pulse{fill:#6366f1;transform-box:fill-box;transform-origin:center;animation:rt-dotping 1.6s ease-out infinite}
@keyframes rt-dotping{0%{transform:scale(.6);opacity:.6}100%{transform:scale(2.4);opacity:0}}
</style>
Angular
// @ts-nocheck
// Note: vanilla JS DOM manipulation is preserved as-is inside ngAfterViewInit().
// For idiomatic Angular, replace document.getElementById() with @ViewChild() refs
// and move state into component properties with two-way binding.
import { Component, AfterViewInit, ViewEncapsulation } from '@angular/core';
import { CommonModule } from '@angular/common';

@Component({
  selector: 'app-realtime-line-chart',
  standalone: true,
  imports: [CommonModule],
  encapsulation: ViewEncapsulation.None,
  template: `
    <div class="rt-card">
      <div class="rt-head">
        <div>
          <div class="rt-label"><span class="rt-live"></span>Active users · live</div>
          <div class="rt-value"><span id="rtNow">0</span><span class="rt-delta" id="rtDelta"></span></div>
        </div>
        <div class="rt-range"><span id="rtMax">0</span> peak</div>
      </div>
    
      <svg class="rt-svg" viewBox="0 0 320 140" preserveAspectRatio="none">
        <defs>
          <linearGradient id="rtGrad" x1="0" y1="0" x2="0" y2="1">
            <stop offset="0%" stop-color="#6366f1" stop-opacity="0.35"/>
            <stop offset="100%" stop-color="#6366f1" stop-opacity="0"/>
          </linearGradient>
        </defs>
        <line class="rt-grid" x1="10" y1="36" x2="310" y2="36"/>
        <line class="rt-grid" x1="10" y1="88" x2="310" y2="88"/>
        <path id="rtArea" class="rt-area" d=""/>
        <path id="rtLine" class="rt-stroke" d=""/>
        <circle id="rtDotPulse" class="rt-pulse" r="6"/>
        <circle id="rtDot" class="rt-dot" r="3.5"/>
      </svg>
    </div>
  `,
  styles: [`
    *{box-sizing:border-box;margin:0;padding:0}
    body{font-family:system-ui,-apple-system,sans-serif;background:#0f172a;min-height:100vh;display:flex;align-items:center;justify-content:center;padding:24px}
    .rt-card{background:#1e293b;border:1px solid #334155;border-radius:16px;padding:20px;width:100%;max-width:380px;box-shadow:0 18px 44px rgba(0,0,0,.4)}
    .rt-head{display:flex;align-items:flex-start;justify-content:space-between;margin-bottom:14px}
    .rt-label{display:flex;align-items:center;gap:7px;font-size:11px;font-weight:700;color:#94a3b8;text-transform:uppercase;letter-spacing:.05em}
    .rt-live{width:8px;height:8px;border-radius:50%;background:#22c55e;position:relative}
    .rt-live::after{content:'';position:absolute;inset:0;border-radius:50%;background:#22c55e;animation:rt-ping 1.6s ease-out infinite}
    @keyframes rt-ping{0%{transform:scale(1);opacity:.7}100%{transform:scale(2.6);opacity:0}}
    .rt-value{display:flex;align-items:baseline;gap:8px;margin-top:6px}
    .rt-value #rtNow{font-size:30px;font-weight:800;color:#f1f5f9;font-variant-numeric:tabular-nums}
    .rt-delta{font-size:13px;font-weight:800;font-variant-numeric:tabular-nums}
    .rt-delta.up{color:#22c55e}
    .rt-delta.down{color:#f87171}
    .rt-range{font-size:11px;color:#64748b;font-weight:600}
    .rt-range span{color:#cbd5e1;font-weight:800}
    
    .rt-svg{width:100%;height:140px;display:block}
    .rt-grid{stroke:rgba(148,163,184,.14);stroke-width:1}
    .rt-area{fill:url(#rtGrad)}
    .rt-stroke{fill:none;stroke:#818cf8;stroke-width:2.5;stroke-linejoin:round;stroke-linecap:round}
    .rt-dot{fill:#fff;stroke:#6366f1;stroke-width:2.5}
    .rt-pulse{fill:#6366f1;transform-box:fill-box;transform-origin:center;animation:rt-dotping 1.6s ease-out infinite}
    @keyframes rt-dotping{0%{transform:scale(.6);opacity:.6}100%{transform:scale(2.4);opacity:0}}
  `]
})
export class RealtimeLineChartComponent implements AfterViewInit {
  ngAfterViewInit(): void {
    var COUNT = 40;
    var X0 = 10, X1 = 310, TOP = 16, BOT = 116;
    var line, area, dot, dotPulse, nowEl, deltaEl, maxEl;
    var data = [];
    var v = 60;
    var peak = 0;
    
    function step(val) {
      val += (Math.random() - 0.48) * 14;
      return Math.max(20, Math.min(160, val));
    }
    
    function render() {
      var min = Math.min.apply(null, data);
      var max = Math.max.apply(null, data);
      if (max - min < 1) max = min + 1;
      var stepX = (X1 - X0) / (COUNT - 1);
      var pts = data.map(function (d, i) {
        var x = X0 + i * stepX;
        var y = BOT - ((d - min) / (max - min)) * (BOT - TOP);
        return [x, y];
      });
      var dLine = 'M ' + pts.map(function (p) { return p[0].toFixed(1) + ' ' + p[1].toFixed(1); }).join(' L ');
      line.setAttribute('d', dLine);
      area.setAttribute('d', dLine + ' L ' + X1 + ' ' + BOT + ' L ' + X0 + ' ' + BOT + ' Z');
    
      var last = pts[pts.length - 1];
      dot.setAttribute('cx', last[0]); dot.setAttribute('cy', last[1]);
      dotPulse.setAttribute('cx', last[0]); dotPulse.setAttribute('cy', last[1]);
    
      var cur = Math.round(data[data.length - 1]);
      var prev = Math.round(data[data.length - 2]);
      nowEl.textContent = cur;
      var diff = cur - prev;
      deltaEl.textContent = (diff >= 0 ? '▲ ' : '▼ ') + Math.abs(diff);
      deltaEl.className = 'rt-delta ' + (diff >= 0 ? 'up' : 'down');
      peak = Math.max(peak, cur);
      maxEl.textContent = peak;
    }
    
    function tick() {
      data.push(step(data[data.length - 1]));
      data.shift();
      render();
    }
    
    function init() {
      line = document.getElementById('rtLine');
      area = document.getElementById('rtArea');
      dot = document.getElementById('rtDot');
      dotPulse = document.getElementById('rtDotPulse');
      nowEl = document.getElementById('rtNow');
      deltaEl = document.getElementById('rtDelta');
      maxEl = document.getElementById('rtMax');
      for (var i = 0; i < COUNT; i++) { v = step(v); data.push(v); }
      render();
      setInterval(tick, 1100);
    }
    init();

    // Bind inline-handler functions to the component so the template can call them
    Object.assign(this, { step, render, tick, init });
  }
}