Learn Coding Visually
Learn to code with interactive, live-preview playgrounds — HTML, CSS, JavaScript, React & more.
 HTML Playground42 lessons · Click-based · Live preview
 CSS PlaygroundLearn CSS with a live editor
 JavaScript Playground60 lessons · DOM · Async · Canvas
 React PlaygroundLearn React with a live code editor
 GSAP PlaygroundLearn GSAP animation interactively
 SVG Playground44 lessons · shapes · paths · animation
 SCSS Playground45 lessons · Sass modules · tokens
 Tailwind PlaygroundLearn Tailwind CSS with a live editor
 Bootstrap 5 Playground50 lessons · live preview
Scroll Stock Candlestick Crash — Free HTML CSS JS Snippet
Scroll Stock Candlestick Crash · Scroll · Plain HTML, CSS & JS · Live preview
What's included
Features
About this UI Snippet
Scroll Stock Candlestick Crash — Sequential Candle Growth, Live Ticker & Trend Line Draw
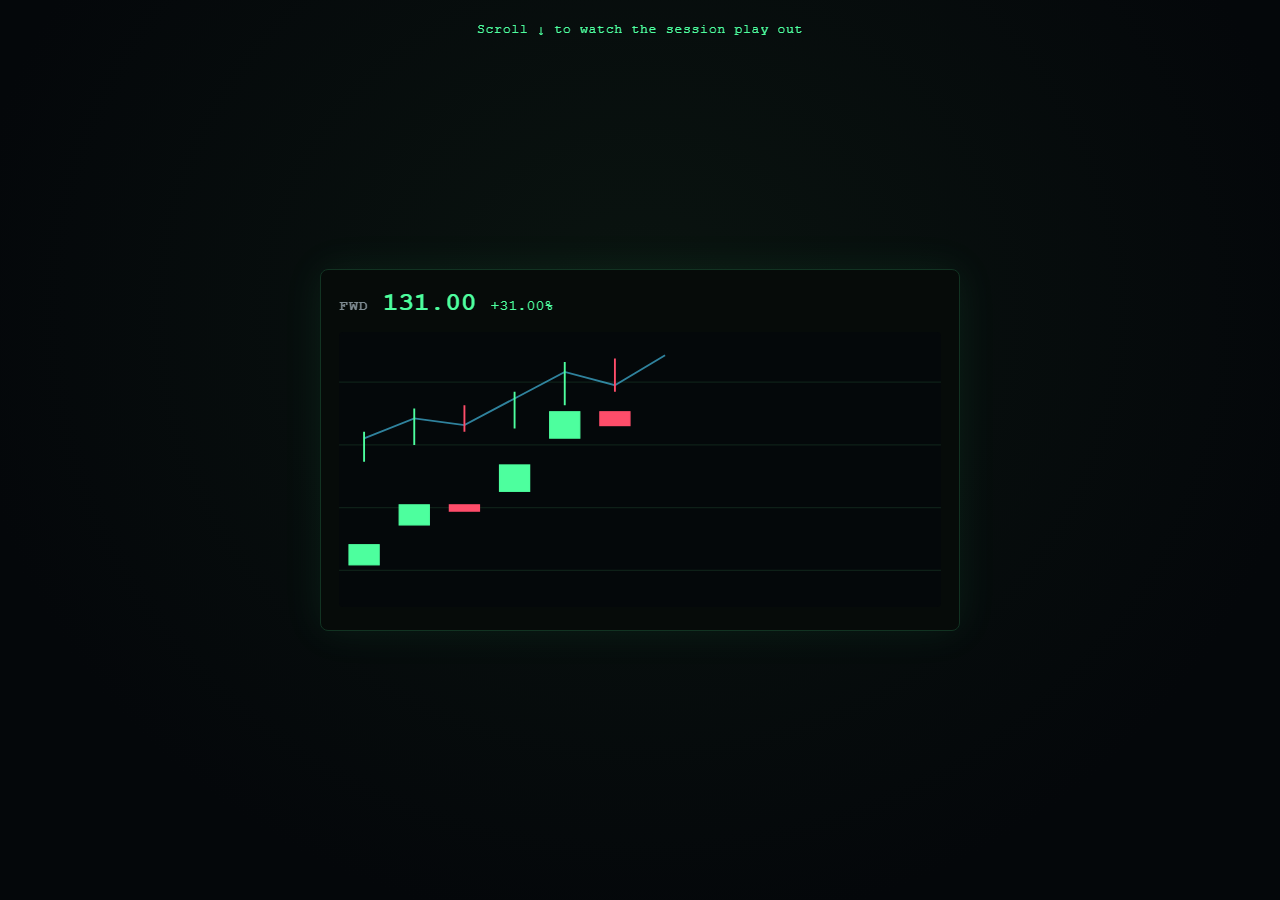
A financial-terminal-style candlestick chart where each candle grows into place as the section scrolls, building a scripted rise-then-crash price pattern while a ticker readout and trend line update live. This is a deliberately different chart type from a typical line-chart draw — candles carry open/high/low/close information, not just a single value per point. Pair with Scroll SVG Path Draw for a pure line-drawing technique, or Scroll Number Odometer for a focused counting-number pattern.
Candles built from real OHLC data
A small data array holds open/high/low/close values per candle. For each entry, a wick <line> spans the high-to-low range and a body <rect> spans the open-to-close range, colored green (.up) or red (.down) depending on whether the close beat the open — standard candlestick chart semantics, just rendered as plain SVG shapes instead of a charting library.
Two-phase reveal per candle
Each candle group starts at opacity: 0 and its body <rect> starts at height: 0 pinned to its close/open midpoint. A shared scrubbed timeline gives candle i a start position of i * 0.08: first a quick opacity fade-in, then a power1.out-eased height/y tween that grows the body to its real dimensions — reading as each candle "printing" onto the chart as the session plays out.
A trend line drawn point by point
Rather than a dash-offset reveal, the trend <polyline>'s points attribute is rebuilt on every scroll tick from a growing slice of the full coordinate array (trendPts.slice(0, count)), driven by the same shared timeline. This produces a line that visibly extends candle by candle, staying synced to however many candles have drawn in so far.
A live ticker synced to timeline position
At each candle's timeline position, a callback updates the price and percent-change readout to that candle's close value, and toggles a .down class for red styling once price falls below the session's opening value — turning the crash into a readable, live-feeling number alongside the visual chart.
Reversibility
Because every candle's opacity/height, the trend line's point count, and the ticker text are all driven by the same scrubbed timeline position, scrolling back up shrinks candles back to zero height in reverse order, retracts the trend line, and rolls the ticker price back down — the "crash" replays as a "recovery" in reverse.
Build with AI
Build, Understand, Optimize, and Extend It With AI
Ask an AI assistant to explain why real OHLC candlestick data (open/high/low/close per period) requires a different rendering approach than a single-value line chart — specifically how the wick-plus-body shape is derived from four numbers per candle rather than one. It's also worth asking about the trend line's point-by-point reveal technique (rebuilding the polyline's points attribute from a growing array slice) versus a stroke-dashoffset reveal, and when each is more appropriate. To extend the snippet, ask the assistant to add a moving-average overlay line, a volume bar beneath each candle, or a way to script the price data from a real historical dataset instead of hand-authored numbers. Use this as a technique reference for data-driven SVG chart generation, not real financial advice or a production trading tool.
Prompt to recreate it
Copy this into your AI assistant of choice to build the effect from scratch, or as a jumping-off point for your own variant:
Build a scroll-scrubbed animated candlestick stock chart in plain HTML, CSS, and JavaScript using GSAP and ScrollTrigger — hand-generated SVG, no charting library, no canvas.

Requirements:
- Define a JavaScript array of 10-12 objects, each with open (o), close (c), high (h), and low (l) numeric price values, scripted to rise for the first two-thirds of the sequence and then crash sharply in the final few entries.
- Write a function that maps a price value to a y-coordinate within a fixed chart height, given a min/max price range.
- Loop over the data array and, for each entry, dynamically create SVG elements: a <line> "wick" spanning the high-to-low y-range at the candle's x position, and a <rect> "body" spanning the open-to-close y-range at a slightly narrower width, both inside a <g> wrapper classed "up" or "down" depending on whether the close is greater than or equal to the open (style up candles green, down candles red via CSS).
- Each generated candle group should start at opacity 0, and its body rect should start with height 0 positioned at its vertical midpoint (store the eventual real height/y as data attributes for later use).
- Create a <polyline> for a trend line and collect each candle's close-price coordinate into an array as you generate the candles, but leave the polyline's points attribute empty initially.
- Create one GSAP timeline whose scrollTrigger has pin: true, a numeric scrub value, and enough scroll distance for the whole sequence to play out comfortably (e.g. end: "+=240%").
- For each candle in the data array at increasing timeline positions, add a tween that fades its group's opacity to 1, followed immediately by a tween that animates its body rect's height and y to the real stored values with a slight ease-out easing.
- At the same timeline position for each candle, add a callback that updates a "price" text readout to that candle's close value and a "percent change" readout computed relative to the very first candle's opening price, toggling a CSS class when the price has crossed below the starting price.
- Separately, tween a numeric counter from 0 to the number of candles across the same overall timeline duration with ease: "none", and on every update rebuild the trend polyline's points attribute using a slice of the collected coordinate array sized to the current counter value, so the trend line visibly extends in sync with however many candles have drawn in.
- Confirm scrolling back up reverses the whole sequence: candles shrink back to zero height in reverse order, the trend line retracts, and the price readout counts back down.
- Style it with a financial-terminal dark palette: near-black background, bright green for up candles and gains, bright red for down candles and losses.
Want to tighten it up first? Run this prompt through the AI Prompt Studio to score it across 8 quality dimensions, catch anti-patterns, and tune the wording for Claude, ChatGPT, or Gemini before you paste it in.
Source Code
<div class="hint">Scroll ↓ to watch the session play out</div>
<section class="terminal-stage">
  <div class="terminal">
    <div class="ticker">
      <span class="sym">FWD</span>
      <span class="price" id="price">100.00</span>
      <span class="pct" id="pct">+0.00%</span>
    </div>
    <svg viewBox="0 0 480 220" class="chart">
      <g class="gridlines">
        <line x1="0" y1="40" x2="480" y2="40" /><line x1="0" y1="90" x2="480" y2="90" />
        <line x1="0" y1="140" x2="480" y2="140" /><line x1="0" y1="190" x2="480" y2="190" />
      </g>
      <polyline id="trendLine" class="trend" points="" />
      <g id="candles"></g>
    </svg>
  </div>
</section>
<div class="spacer"></div>
* { box-sizing: border-box; }
body { margin: 0; font-family: 'Courier New', monospace; background: #05070a; color: #d6ffe0; }
.hint { position: sticky; top: 12px; text-align: center; font-size: 13px; letter-spacing: 0.06em; color: #4dff9e; z-index: 5; padding: 10px; }
.terminal-stage { height: 100vh; display: flex; align-items: center; justify-content: center; background: radial-gradient(ellipse at 50% 35%, #0a1410 0%, #04070a 75%); }
.spacer { height: 220vh; }
.terminal { width: min(92vw, 640px); background: #060b09; border: 1px solid #123322; border-radius: 8px; padding: 18px; box-shadow: 0 0 40px rgba(77,255,158,0.08); }
.ticker { display: flex; align-items: baseline; gap: 14px; margin-bottom: 14px; }
.sym { font-size: 15px; font-weight: 700; color: #7d8a90; letter-spacing: 0.06em; }
.price { font-size: 26px; font-weight: 700; color: #4dff9e; }
.pct { font-size: 15px; color: #4dff9e; }
.pct.down { color: #ff4d6a; }
.chart { width: 100%; height: auto; background: #04080a; border-radius: 4px; }
.gridlines line { stroke: #0e2018; stroke-width: 1; }
.trend { fill: none; stroke: #4dd4ff; stroke-width: 1.5; opacity: 0.6; }
.candle-wick { stroke-width: 1.5; }
.candle-body { }
.up .candle-wick, .up .candle-body { stroke: #4dff9e; fill: #4dff9e; }
.down .candle-wick, .down .candle-body { stroke: #ff4d6a; fill: #ff4d6a; }gsap.registerPlugin(ScrollTrigger);
var candlesGroup = document.getElementById('candles');
var trendLine = document.getElementById('trendLine');
var priceEl = document.getElementById('price');
var pctEl = document.getElementById('pct');
var data = [
{ o: 100, c: 106, h: 108, l: 99 },
{ o: 106, c: 112, h: 115, l: 104 },
{ o: 112, c: 110, h: 116, l: 108 },
{ o: 110, c: 118, h: 120, l: 109 },
{ o: 118, c: 126, h: 129, l: 116 },
{ o: 126, c: 122, h: 130, l: 120 },
{ o: 122, c: 131, h: 134, l: 121 },
{ o: 131, c: 124, h: 133, l: 118 },
{ o: 124, c: 108, h: 126, l: 104 },
{ o: 108, c: 86, h: 110, l: 80 },
{ o: 86, c: 68, h: 90, l: 60 },
{ o: 68, c: 72, h: 78, l: 62 },
];
var minP = 55, maxP = 138;
var chartW = 480, chartH = 220;
var candleW = chartW / data.length;
function y(price) { return chartH - ((price - minP) / (maxP - minP)) * chartH; }
var trendPts = [];
data.forEach(function (d, i) {
var cx = i * candleW + candleW / 2;
var up = d.c >= d.o;
var g = document.createElementNS('http://www.w3.org/2000/svg', 'g');
g.setAttribute('class', up ? 'up' : 'down');
g.style.opacity = 0;
var wick = document.createElementNS('http://www.w3.org/2000/svg', 'line');
wick.setAttribute('class', 'candle-wick');
wick.setAttribute('x1', cx); wick.setAttribute('x2', cx);
wick.setAttribute('y1', y(d.h)); wick.setAttribute('y2', y(d.l));
g.appendChild(wick);
var bodyTop = y(Math.max(d.o, d.c));
var bodyH = Math.max(2, Math.abs(y(d.o) - y(d.c)));
var body = document.createElementNS('http://www.w3.org/2000/svg', 'rect');
body.setAttribute('class', 'candle-body');
body.setAttribute('x', cx - candleW * 0.3);
body.setAttribute('width', candleW * 0.6);
body.setAttribute('y', bodyTop);
body.setAttribute('height', 0);
body.dataset.finalH = bodyH;
body.dataset.finalY = bodyTop;
g.appendChild(body);
candlesGroup.appendChild(g);
trendPts.push(cx + ',' + y(d.c));
});
var tl = gsap.timeline({
scrollTrigger: {
trigger: '.terminal-stage',
start: 'top top',
end: '+=240%',
scrub: 0.4,
pin: true,
},
});
var bodies = candlesGroup.querySelectorAll('.candle-body');
var groups = candlesGroup.querySelectorAll('g');
data.forEach(function (d, i) {
var pos = i * 0.08;
var body = bodies[i];
var group = groups[i];
tl.to(group, { opacity: 1, duration: 0.05 }, pos)
.to(body, {
height: parseFloat(body.dataset.finalH),
y: parseFloat(body.dataset.finalY),
duration: 0.06,
ease: 'power1.out',
}, pos);
tl.add(function () {
var up = d.c >= d.o;
var startPrice = data[0].o;
var change = (((d.c - startPrice) / startPrice) * 100).toFixed(2);
priceEl.textContent = d.c.toFixed(2);
pctEl.textContent = (change >= 0 ? '+' : '') + change + '%';
pctEl.classList.toggle('down', d.c < startPrice);
}, pos);
});
var trendDraw = { n: 0 };
tl.to(trendDraw, {
n: data.length - 1,
ease: 'none',
duration: data.length * 0.08,
onUpdate: function () {
var count = Math.max(1, Math.ceil(trendDraw.n) + 1);
trendLine.setAttribute('points', trendPts.slice(0, count).join(' '));
},
}, 0);Step by step
How to Use
- 1Scroll through the sessionScroll down slowly — candles print onto the chart one by one, the trend line extends to follow, and the ticker price/percentage updates live, ending in a sharp crash.
- 2Scroll back upCandles shrink back down in reverse order, the trend line retracts, and the ticker price rolls back up, confirming full reversibility.
- 3Change the price dataEdit the open/high/low/close values in the data array in the JS panel to script a different price pattern.
- 4Add more candlesAdd more { o, c, h, l } objects to the data array — candleW and the timeline stagger automatically adjust to however many entries exist.
- 5Adjust crash severityChange minP/maxP in the JS panel to rescale the y-axis, making price swings look larger or smaller relative to the chart height.
- 6Export in your formatClick "HTML" for a standalone file, "JSX" for React, or "Tailwind" for a React + Tailwind version.
Real-world uses
Common Use Cases
Got questions?
Frequently Asked Questions
It is hand-generated plain SVG — a JS data array of open/high/low/close values is looped over to create <line> wicks and <rect> bodies at build time, with GSAP tweening their opacity and dimensions during scroll. No charting library is used.
A line chart draws a single continuous value (like a stroke-dashoffset reveal on one path). This snippet renders full OHLC candlesticks — each candle has a wick (high/low range) and a body (open/close range) colored by direction — which is a fundamentally different data shape and visual grammar from a line chart.
Rather than a stroke-dashoffset reveal, the trend line's points attribute is rebuilt on every scroll tick from a growing slice of the full coordinate array, sized to match how many candles have appeared on the same shared timeline — so the line always ends exactly at the most recently drawn candle.
At each candle's timeline position, a callback compares that candle's close price to the very first candle's opening price. If the current price has fallen below the starting price, a .down CSS class is toggled on the percentage readout, switching its color to red.
Yes — the entire chart is generated from the data array of { o, c, h, l } objects. Replace the values with any open/high/low/close sequence you want, and the candle generation, trend line, and ticker will all reflect the new pattern automatically.