Learn Coding Visually
Learn to code with interactive, live-preview playgrounds — HTML, CSS, JavaScript, React & more.
 HTML Playground42 lessons · Click-based · Live preview
 CSS PlaygroundLearn CSS with a live editor
 JavaScript Playground60 lessons · DOM · Async · Canvas
 React PlaygroundLearn React with a live code editor
 GSAP PlaygroundLearn GSAP animation interactively
 SVG Playground44 lessons · shapes · paths · animation
 SCSS Playground45 lessons · Sass modules · tokens
 Tailwind PlaygroundLearn Tailwind CSS with a live editor
 Bootstrap 5 Playground50 lessons · live preview
Scroll Seismograph Needle Draw — Free HTML CSS JS Snippet
Scroll Seismograph Needle Draw · Scroll · Plain HTML, CSS & JS · Live preview
What's included
Features
About this UI Snippet
Scroll Seismograph Needle Draw — stroke-dashoffset Reveal, getPointAtLength Needle & Scrubbed Amplitude
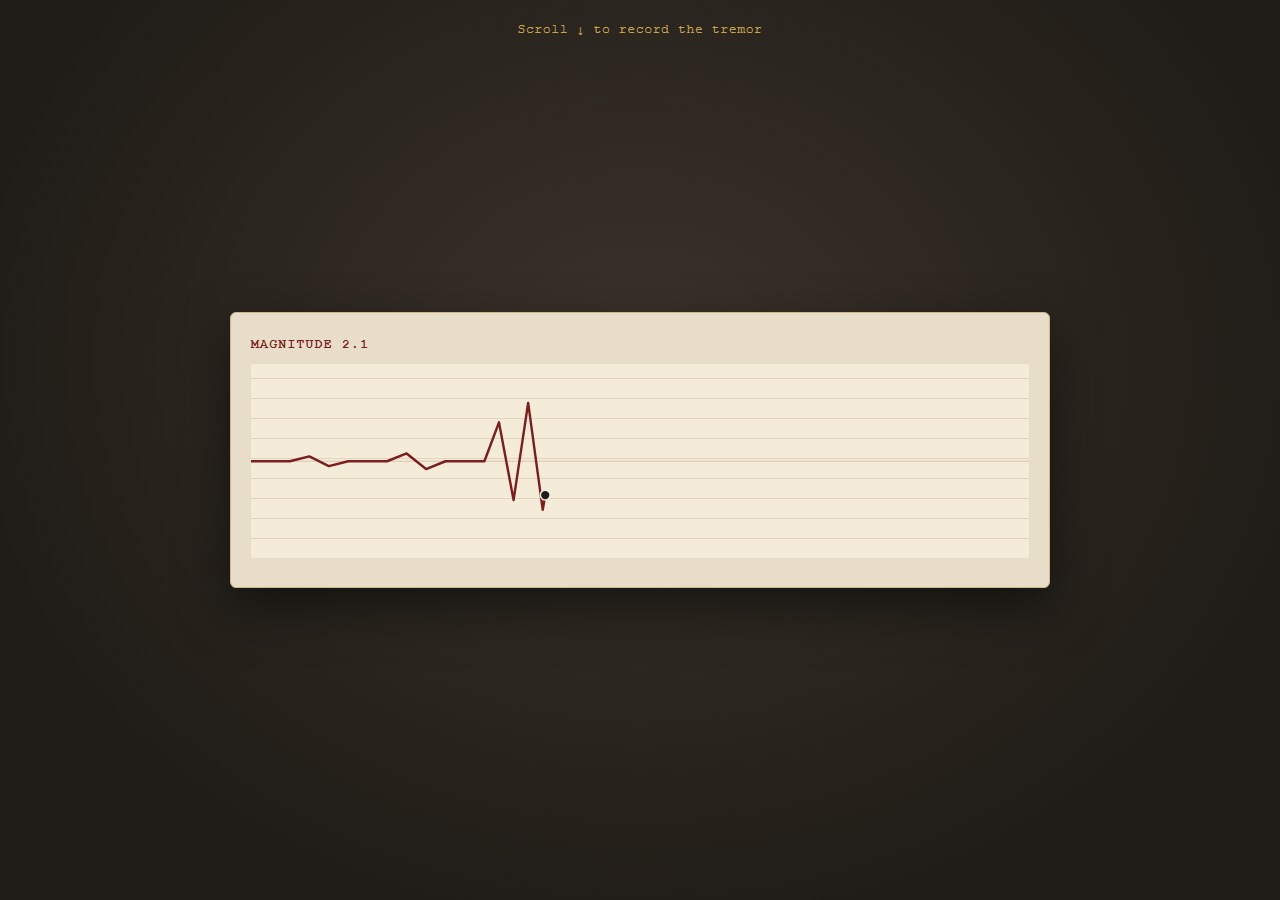
A seismograph-style recorder where a jagged waveform draws itself across aged paper as you scroll, complete with a pen needle that visibly traces the line's live end point and a scripted "earthquake" moment where the amplitude spikes dramatically. Pair with Scroll SVG Path Draw for the underlying line-draw technique on its own, or Scroll Progress for a simpler linear scrub indicator.
The waveform is one hand-authored SVG path
#wave is a single <path> built from a long sequence of L (line-to) commands whose y-values wobble gently near the baseline for most of the strip, then swing dramatically between y=40 and y=150 for a short stretch in the middle — that scripted spike is baked directly into the path data, not computed at runtime.
Revealing it with stroke-dashoffset
On load, wave.getTotalLength() is read once, and both stroke-dasharray and stroke-dashoffset are set to that length — this hides the entire line behind one giant dash gap. A scrubbed tween animates a plain { d: 0 } object from 0 to 1, and on every onUpdate, strokeDashoffset is set to len - d * len, progressively revealing the path from its start. This is the standard SVG "line draw" technique, driven here by scroll instead of time.
The pen needle follows the live endpoint
The same d value that drives the dash-offset reveal also feeds wave.getPointAtLength(d * len) — the exact coordinate the drawn line has just reached. A small circle (#pen) is positioned there on every update, so it always sits exactly at the tip of the currently-drawn ink, like a real seismograph pen.
A magnitude readout reacting to the same progress value
The MAGNITUDE number is computed from d with a formula that stays low most of the time but multiplies up sharply while d is between 0.28 and 0.42 — the same window where the path data itself has its big spike — so the numeric readout and the visual spike always line up.
Why pin: true
The recorder is a fixed instrument the viewer watches record a tremor; pinning it for end: '+=220%' of scroll keeps that "instrument" on screen for the whole drawing sequence, and because the reveal is entirely dash-offset and progress-driven, scrolling back up erases the line and walks the pen back to the start exactly in reverse.
Build with AI
Build, Understand, Optimize, and Extend It With AI
This snippet combines two SVG primitives that are individually common but rarely shown working together: stroke-dashoffset for progressive line reveal, and getPointAtLength for placing a marker at the currently-revealed tip. Ask an AI assistant to explain why both must be driven from the exact same progress value (rather than two separately-tweened numbers) to keep the pen glued to the line's endpoint. It's also worth asking the assistant to walk through how the scripted amplitude spike is authored directly into the path's coordinate data rather than generated procedurally, and what a procedural (e.g. noise-based) version might look like instead. To extend it, ask for multiple pens tracking multiple simultaneous waveforms, or a version where the paper appears to scroll under a fixed pen instead of the pen moving across fixed paper. Use it as a technique reference, not a finished instrument.
Prompt to recreate it
Copy this into your AI assistant of choice to build the effect from scratch, or as a jumping-off point for your own variant:
Build a scroll-scrubbed "seismograph" line-drawing animation in plain HTML, CSS, and JavaScript using GSAP and ScrollTrigger — real SVG, no canvas.

Requirements:
- Author a single SVG <path> using line-to (L) commands representing a jagged waveform that stays close to a baseline y-value for most of its length, but swings dramatically higher and lower for one contiguous stretch near the middle, simulating an earthquake spike.
- On page load, call path.getTotalLength() once, then set both the path's stroke-dasharray and stroke-dashoffset CSS properties to that length, hiding the entire stroke.
- Create a GSAP timeline whose scrollTrigger has pin: true, a numeric scrub value, and generous scroll distance (e.g. end: "+=220%").
- In that timeline, tween a plain object's numeric property from 0 to 1 with ease: "none", and on every onUpdate: (1) set the path's stroke-dashoffset to (totalLength - progress * totalLength) so the line progressively draws itself from its start, and (2) call path.getPointAtLength(progress * totalLength) to get the current drawn tip's coordinates, then set an SVG <circle> element's cx/cy to that point so it always sits exactly at the line's live end.
- Add a text readout showing a computed "magnitude" number derived from the same progress value, using a formula that produces noticeably larger values while progress is within the same range where the path's coordinate data has its dramatic spike, so the numeric readout and the visual spike stay synchronized.
- Confirm scrolling back up reverses everything: the line erases from its end backward and the pen circle retreats along with it.
- Style it with an aged-paper aesthetic: cream/parchment paper background with faint horizontal ruled lines, a deep red ink stroke color, and a dark wood-toned outer frame.
Want to tighten it up first? Run this prompt through the AI Prompt Studio to score it across 8 quality dimensions, catch anti-patterns, and tune the wording for Claude, ChatGPT, or Gemini before you paste it in.
Source Code
<div class="hint">Scroll ↓ to record the tremor</div>
<section class="seismo-stage">
  <div class="recorder">
    <div class="readout">MAGNITUDE <span id="mag">0.0</span></div>
    <svg viewBox="0 0 800 200" class="paper">
      <line x1="0" y1="100" x2="800" y2="100" class="baseline" />
      <path id="wave" class="wave"
        d="M0,100 L40,100 L60,95 L80,105 L100,100 L140,100 L160,92 L180,108 L200,100
           L240,100 L255,60 L270,140 L285,40 L300,150 L315,60 L330,110 L345,100
           L380,100 L400,98 L420,102 L440,100 L480,100 L500,96 L520,104 L540,100
           L580,100 L600,100 L800,100" />
      <circle id="pen" class="pen" r="5" cy="100" cx="0" />
    </svg>
  </div>
</section>
<div class="spacer"></div>
* { box-sizing: border-box; }
body { margin: 0; font-family: 'Courier New', monospace; background: #2b2620; color: #e8ddc8; }
.hint { position: sticky; top: 12px; text-align: center; font-size: 13px; letter-spacing: 0.05em; color: #c9a24a; z-index: 5; padding: 10px; }
.seismo-stage { height: 100vh; display: flex; align-items: center; justify-content: center; background: radial-gradient(ellipse at 50% 40%, #3a332a 0%, #201c17 75%); }
.spacer { height: 220vh; }
.recorder { width: min(92vw, 820px); background: #e8ddc8; border-radius: 6px; padding: 24px 20px; box-shadow: 0 20px 50px rgba(0,0,0,0.5); border: 1px solid #c9b98a; }
.readout { font-size: 13px; letter-spacing: 0.1em; color: #7a1f1f; margin-bottom: 12px; font-weight: 700; }
.paper { width: 100%; height: auto; background:
repeating-linear-gradient(0deg, transparent 0 19px, rgba(122,31,31,0.12) 19px 20px),
#f4ecd8;
border-radius: 2px;
}
.baseline { stroke: rgba(122,31,31,0.2); stroke-width: 1; }
.wave { fill: none; stroke: #7a1f1f; stroke-width: 2.5; stroke-linecap: round; stroke-linejoin: round; }
.pen { fill: #1c1c1c; stroke: #f4ecd8; stroke-width: 1.5; }gsap.registerPlugin(ScrollTrigger);
var wave = document.getElementById('wave');
var pen = document.getElementById('pen');
var magEl = document.getElementById('mag');
var len = wave.getTotalLength();
wave.style.strokeDasharray = len;
wave.style.strokeDashoffset = len;
var state = { d: 0 };
function update(d) {
wave.style.strokeDashoffset = len - d * len;
var point = wave.getPointAtLength(d * len);
pen.setAttribute('cx', point.x);
pen.setAttribute('cy', point.y);
var mag = 1.5 + Math.abs(Math.sin(d * 18)) * (d > 0.28 && d < 0.42 ? 7.5 : 1.5);
magEl.textContent = mag.toFixed(1);
}
gsap.timeline({
scrollTrigger: {
trigger: '.seismo-stage',
start: 'top top',
end: '+=220%',
scrub: 0.4,
pin: true,
},
}).to(state, {
d: 1,
ease: 'none',
duration: 1,
onUpdate: function () { update(state.d); },
});
update(0);Step by step
How to Use
- 1Scroll through the recordingScroll down slowly — the waveform draws itself left to right, the pen needle traces its tip, and the magnitude readout spikes sharply during the scripted tremor.
- 2Scroll back upThe line erases itself and the pen retreats back toward the start, confirming full reversibility.
- 3Reshape the waveformEdit the "d" attribute on #wave in the HTML panel — add more L commands with varying y-values to change the wobble pattern or spike shape.
- 4Move the earthquake momentChange the d > 0.28 && d < 0.42 range in the JS panel's magnitude formula to shift when the readout spike occurs.
- 5Adjust drawing speedIncrease or decrease end: "+=220%" on the ScrollTrigger to spread the draw across more or less scroll distance.
- 6Export in your formatClick "HTML" for a standalone file, "JSX" for React, or "Tailwind" for a React + Tailwind version.
Real-world uses
Common Use Cases
Got questions?
Frequently Asked Questions
The path's stroke-dasharray and stroke-dashoffset are both set to its total length on load, hiding it behind one giant gap. A scrubbed tween reduces stroke-dashoffset from that full length down to 0 as scroll progresses, progressively revealing the stroke from its start point — the standard SVG line-draw technique.
The same scroll-mapped progress value (0 to 1) used for the dash-offset reveal is also passed to path.getPointAtLength(progress * totalLength), which returns the exact {x, y} coordinate the drawn portion has just reached. A small circle is positioned there on every update.
Two things work together: the path's own coordinate data has a section with much larger y-swings than the rest of the line, and the magnitude readout formula multiplies its output while the progress value falls within that same range, so the visual spike and the numeric spike always coincide.
Yes — add more dramatic y-value swings at different points in the path's "d" attribute, and extend the magnitude formula's conditional check to boost the readout during those additional progress ranges too.
The recorder functions like a fixed instrument being watched in real time — pinning keeps it in view for the full scrubbed drawing sequence rather than having it scroll away before the line finishes drawing.