Learn Coding Visually
Learn to code with interactive, live-preview playgrounds — HTML, CSS, JavaScript, React & more.
 HTML Playground42 lessons · Click-based · Live preview
 CSS PlaygroundLearn CSS with a live editor
 JavaScript Playground60 lessons · DOM · Async · Canvas
 React PlaygroundLearn React with a live code editor
 GSAP PlaygroundLearn GSAP animation interactively
 SVG Playground44 lessons · shapes · paths · animation
 SCSS Playground45 lessons · Sass modules · tokens
 Tailwind PlaygroundLearn Tailwind CSS with a live editor
 Bootstrap 5 Playground50 lessons · live preview
Scroll Terrain Contour Lines — Free HTML CSS JS Snippet
Scroll Terrain Contour Lines · Scroll · Plain HTML, CSS & JS · Live preview
What's included
Features
About this UI Snippet
Scroll Terrain Contour Lines — stroke-dashoffset Path Drawing & Sequential Elevation Bands
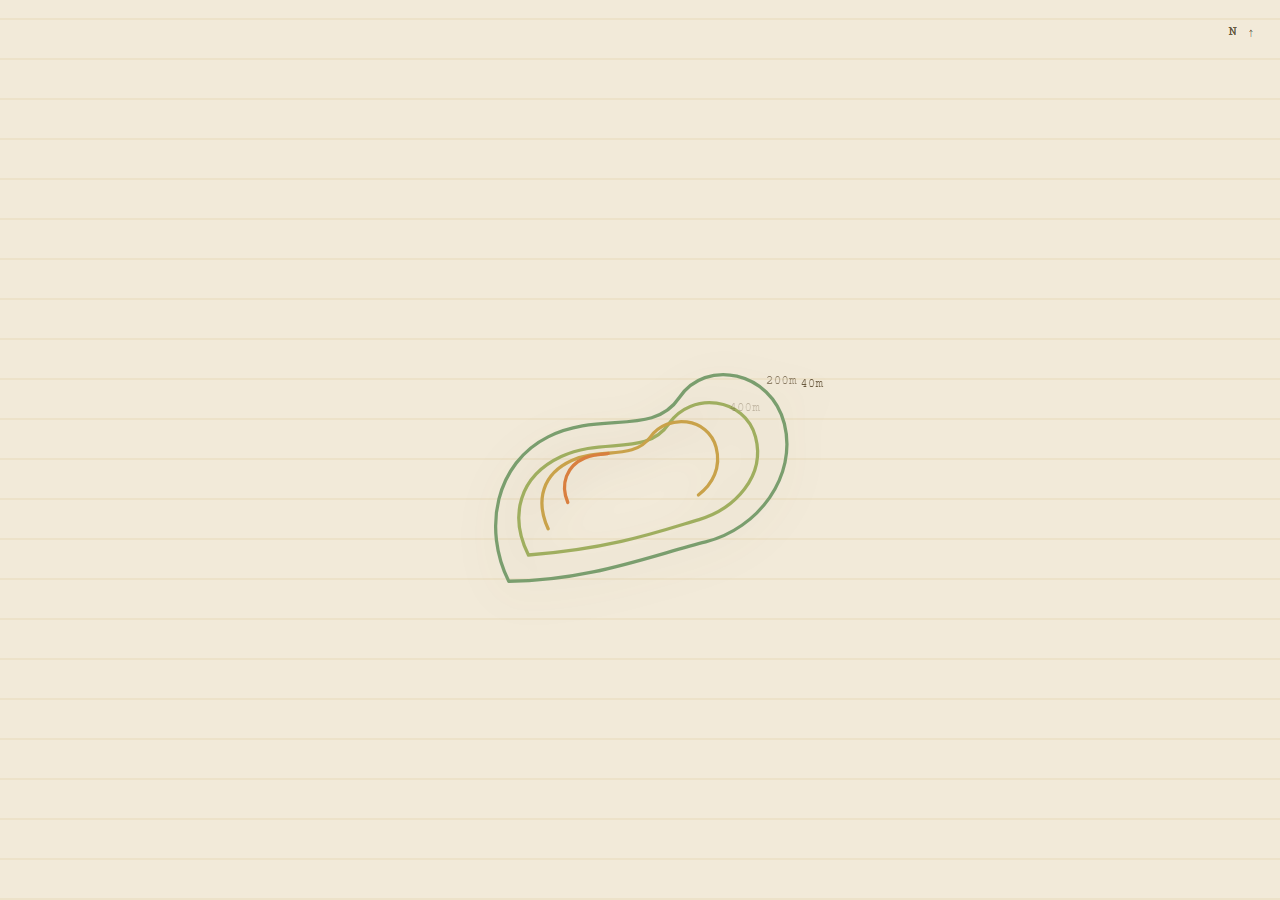
This snippet builds a topographic map illustration from nested SVG contour paths that each draw themselves on stroke-by-stroke, one elevation band at a time, as the user scrolls — the classic technique used for Scroll SVG Path Draw applied here to a layered, band-by-band map rather than a single line.
Measuring and hiding each path with getTotalLength
Every .contour path calls path.getTotalLength() to get its exact perimeter in pixels, then sets both strokeDasharray and strokeDashoffset to that length. A dash pattern exactly as long as the path, offset by its own length, makes the entire stroke invisible — a single continuous "dash" pushed completely out of view. This works identically for any path shape without needing to know its geometry in advance.
Sequential reveal, band by band
Rather than drawing all contour lines simultaneously, the outermost (lowest elevation) path is assigned the first timeline segment, and each subsequent nested path — representing a higher elevation band — gets the next segment, using the same segStart/segEnd fractional-timeline technique as Scroll Book Shelf Slide. strokeDashoffset animates to 0, drawing that band's outline, while a very light fillOpacity fade (0.06) washes in behind it to suggest elevation shading without obscuring the lines above.
Fading elevation labels
Each contour path has a matching elevation label ("40m" through "840m") positioned near where that band would sit on a real topo map. Labels fade in slightly after their corresponding contour finishes drawing (at segEnd), reinforcing the sense of a map being surveyed and annotated as you scroll, ending with a small peak-marker dot fading in near the summit once the innermost band is complete.
A graph-paper survey background
The stage background uses two repeating-linear-gradients (one horizontal, one vertical) to produce a grid pattern reminiscent of surveyor's graph paper, reinforcing the topographic-map aesthetic without any image asset.
Fully reversible
Because strokeDashoffset, fillOpacity, and label opacity are all on the same scrubbed timeline, scrolling back up erases each band and its label in reverse order, back to a blank map.
Build with AI
Build, Understand, Optimize, and Extend It With AI
Paste this snippet's HTML, CSS and JS into an AI coding assistant and ask it to explain the getTotalLength/stroke-dasharray/stroke-dashoffset trick in detail — specifically why setting dasharray and dashoffset to the exact same measured length is what makes a path invisible before it draws, regardless of the path's actual shape or complexity. It's a great snippet to extend with an assistant: ask it to generate the contour path data programmatically from a simple 2D noise/heightmap function instead of hand-drawn paths, to add a hover interaction that shows the exact elevation at the cursor's position, or to animate a small marker moving along the innermost contour path once it finishes drawing, using the same getTotalLength technique combined with GSAP's MotionPath (as in Scroll Path Follow).
Prompt to recreate it
Copy this into your AI assistant of choice to build the effect from scratch, or as a jumping-off point for your own variant:
Build a scroll-driven topographic contour map illustration in HTML, CSS and JavaScript using GSAP and ScrollTrigger, with plain inline SVG — no canvas, no WebGL, no external map images.

Requirements:
- Draw a set of several nested, roughly concentric closed SVG paths (like nested blobs), each representing a higher elevation band than the one outside it, each given a distinct stroke color forming a low-to-high elevation color ramp (e.g. green through yellow to red).
- On page load, measure each path's length with getTotalLength() and set its stroke-dasharray and stroke-dashoffset both to that exact length so every path starts completely undrawn/invisible regardless of its shape.
- Wrap the map in a tall scroll section and, using one GSAP timeline attached via ScrollTrigger with scrub: true, animate each path's stroke-dashoffset down to 0 in sequence from the outermost (lowest elevation) band to the innermost (highest), giving each band its own fractional slice of the total scroll range so they draw on one at a time rather than simultaneously; also fade in a very light fill-opacity on each band as it draws for a subtle elevation-shading effect.
- Add small elevation label text elements near each band that fade in once that band's drawing animation completes.
- The whole map must draw forward and erase in reverse cleanly as the user scrolls down and back up.
- Use an earthy topographic color palette (greens through browns to reds) on a graph-paper-style background built from CSS repeating-linear-gradients.
Want to tighten it up first? Run this prompt through the AI Prompt Studio to score it across 8 quality dimensions, catch anti-patterns, and tune the wording for Claude, ChatGPT, or Gemini before you paste it in.
Source Code
<div class="hint">Scroll ↓ to survey the terrain</div>
<div class="topo-wrap">
  <div class="topo-stage">
    <svg viewBox="0 0 320 320" class="topo-svg">
      <path class="contour c0" d="M60,260 C40,220 50,170 90,150 C130,130 170,150 190,120 C210,90 260,100 270,140 C280,180 250,220 210,230 C170,240 120,260 60,260 Z" />
      <path class="contour c1" d="M75,240 C60,210 68,180 100,165 C132,150 165,165 182,140 C199,115 240,120 248,150 C256,180 232,205 205,213 C178,221 140,235 75,240 Z" />
      <path class="contour c2" d="M90,220 C80,198 86,178 108,168 C130,158 155,168 168,150 C181,132 212,135 218,158 C224,181 206,198 186,203 C166,208 138,215 90,220 Z" />
      <path class="contour c3" d="M105,200 C99,186 104,172 118,166 C132,160 148,166 156,155 C164,144 184,146 188,162 C192,178 180,190 166,193 C152,196 133,198 105,200 Z" />
      <path class="contour c4" d="M120,182 C117,174 121,166 130,163 C139,160 147,163 151,157 C155,151 166,152 168,161 C170,170 163,177 155,179 C147,181 136,181 120,182 Z" />
      <circle cx="152" cy="168" r="2.5" class="peak-dot" />
      <text x="160" y="165" class="elev-label el4">840m</text>
      <text x="196" y="150" class="elev-label el3">620m</text>
      <text x="228" y="130" class="elev-label el2">400m</text>
      <text x="256" y="110" class="elev-label el1">200m</text>
      <text x="282" y="112" class="elev-label el0">40m</text>
    </svg>
    <div class="compass">N ↑</div>
  </div>
</div>
* { box-sizing: border-box; }
body { margin: 0; font-family: 'Courier New', monospace; background: #f2ead9; color: #4a3b28; }
.hint { text-align: center; padding: 28px 16px; font-size: 13px; letter-spacing: 0.06em; text-transform: uppercase; color: #8a7455; }
.topo-wrap { height: 420vh; position: relative; }
.topo-stage { position: sticky; top: 0; height: 100vh; display: flex; align-items: center; justify-content: center; background: repeating-linear-gradient(0deg, #ede2c9 0 2px, #f2ead9 2px 40px), repeating-linear-gradient(90deg, #ede2c9 0 2px, transparent 2px 40px); }
.topo-svg { width: min(420px, 88vw); height: auto; filter: drop-shadow(0 10px 20px rgba(74,59,40,0.15)); }
.contour { fill: none; stroke-width: 2.5; stroke-linecap: round; stroke-linejoin: round; fill-opacity: 0; }
.c0 { stroke: #7a9e6e; }
.c1 { stroke: #9fae5f; }
.c2 { stroke: #c9a24a; }
.c3 { stroke: #d97f3f; }
.c4 { stroke: #b8452f; }
.peak-dot { fill: #b8452f; opacity: 0; }
.elev-label { font-size: 9px; letter-spacing: 0.05em; fill: #6b5a3f; opacity: 0; font-family: 'Courier New', monospace; }
.compass { position: absolute; top: 24px; right: 24px; font-size: 13px; font-weight: 700; letter-spacing: 0.1em; color: #6b5a3f; }
@media (max-width: 640px) { .topo-svg { width: 92vw; } }gsap.registerPlugin(ScrollTrigger);
const contours = gsap.utils.toArray('.contour');
const labels = gsap.utils.toArray('.elev-label');
const peakDot = document.querySelector('.peak-dot');
contours.forEach((path) => {
const len = path.getTotalLength();
path.style.strokeDasharray = len;
path.style.strokeDashoffset = len;
});
const tl = gsap.timeline({
scrollTrigger: {
trigger: '.topo-wrap',
start: 'top top',
end: 'bottom bottom',
scrub: true,
},
});
contours.forEach((path, i) => {
const segStart = i / contours.length;
const segEnd = (i + 0.8) / contours.length;
tl.to(path, { strokeDashoffset: 0, fillOpacity: 0.06, ease: 'none' }, segStart);
const label = labels[contours.length - 1 - i];
if (label) {
tl.to(label, { opacity: 1, ease: 'none' }, segEnd);
}
});
tl.to(peakDot, { opacity: 1, ease: 'none' }, 0.85);
ScrollTrigger.refresh();Step by step
How to Use
- 1Scroll through the previewScroll down slowly — each nested contour line draws itself on from outside in, with elevation labels fading in as each band completes.
- 2Add or remove elevation bandsAdd a new .contour path (nested inside the existing shapes) with its own stroke color class, plus a matching .elev-label text element with the new elevation value.
- 3Adjust drawing speed per bandChange segStart/segEnd math in the JS panel (currently i / contours.length and (i + 0.8) / contours.length) to give bands more or less overlap.
- 4Restyle the contour colorsEdit the .c0 through .c4 stroke colors to build your own low-to-high elevation color ramp.
- 5Change the background gridAdjust the repeating-linear-gradient spacing (40px) in .topo-stage to make the survey grid finer or coarser.
- 6Export in your formatClick "HTML" for a standalone file, "JSX" for a React component, or "Tailwind" for a React + Tailwind version.
Real-world uses
Common Use Cases
Got questions?
Frequently Asked Questions
path.getTotalLength() returns the path's exact pixel length. Setting stroke-dasharray to that length creates one dash exactly as long as the path, and setting stroke-dashoffset to the same value shifts that dash completely off the visible path. Animating dashoffset to 0 slides the dash back into view, revealing the stroke progressively from start to end.
Each nested contour path is assigned its own fractional segment of the shared scroll timeline (segStart to segEnd based on its index), so the outermost (lowest elevation) band draws first and each subsequent nested band draws afterward, matching how a real topographic survey builds up from base elevation upward.
Each label's opacity tween is placed at its corresponding contour's segEnd timeline position, so it fades in right as that band finishes drawing rather than all labels appearing simultaneously.
Yes — replace the hand-drawn path d attributes with paths generated from real elevation/contour data (e.g. exported from GIS software or D3's contour generator), the drawing technique works identically regardless of path complexity.
No — the map, grid background, and all contour lines are pure SVG and CSS gradients, so the whole thing is stylable and scalable without external assets.