You Might Also Like
Learn Coding Visually
Learn to code with interactive, live-preview playgrounds — HTML, CSS, JavaScript, React & more.
 HTML Playground42 lessons · Click-based · Live preview
 CSS PlaygroundLearn CSS with a live editor
 JavaScript Playground60 lessons · DOM · Async · Canvas
 React PlaygroundLearn React with a live code editor
 GSAP PlaygroundLearn GSAP animation interactively
 SVG Playground44 lessons · shapes · paths · animation
 SCSS Playground45 lessons · Sass modules · tokens
 Tailwind PlaygroundLearn Tailwind CSS with a live editor
 Bootstrap 5 Playground50 lessons · live preview
Weather Forecast — 5-Day Forecast Card HTML CSS JS
Weather Forecast · Dashboards · Plain HTML, CSS & JS · Live preview
What's included
Features
About this UI Snippet
Weather Forecast — Current Conditions Plus a 5-Day Outlook Row
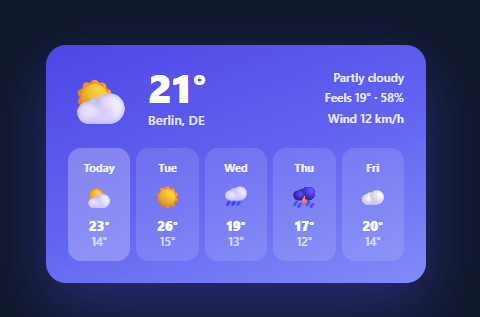
A weather forecast card shows the current conditions prominently and a multi-day outlook beneath — the layout of every weather app and dashboard widget. This snippet builds it in plain HTML, CSS, and vanilla JavaScript: a current-conditions header with temperature and details, plus a 5-day row of glassy day tiles with high/low temps, driven by a clean weather-code-to-icon mapping — no library.
A code-to-icon mapping, not hardcoded emoji
The important design choice is that conditions are represented by *codes* (sunny, rain, storm), which map to display icons and labels through ICONS and LABELS lookup tables. Real weather APIs return numeric or string condition codes, so mapping codes → presentation in one place is exactly how you'd integrate one: you translate the API's codes to these keys once, and every icon and label across the card follows. Hardcoding emoji per day would make swapping in real data a rewrite; the lookup makes it a mapping.
Current conditions, prominent
The header pairs a large condition icon and temperature with the location, and a right-aligned meta block showing the label, "feels like," humidity, and wind. Giving the current temperature the most visual weight (largest type) matches how people read a weather widget — now first, outlook second.
A 5-day outlook row
Below, each day is an equal-width glassy tile (semi-transparent over the gradient, with backdrop-filter blur) showing the day name, its condition icon, and high/low temperatures — high bold, low dimmed, the standard hierarchy so the more relevant high temp dominates. Today's tile is subtly highlighted so the user can anchor the outlook to the present. The tiles lift slightly on hover for a touch of interactivity.
A cohesive gradient theme
The card uses a single blue gradient background with translucent white tiles, so it reads as one polished widget rather than a set of boxes. The glass tiles over the gradient are what give it the modern weather-app look, and they'd adapt to a different palette (a warm gradient for sunny, cool for rain) if you wanted condition-driven theming.
Data-driven and drop-in
The card renders from a CURRENT object and a FORECAST array, so wiring it to a real API means fetching, mapping the response into those shapes (and the codes into the icon keys), and rendering. It's a clear, dependency-free reference for the current-plus-outlook weather layout and the code-to-presentation mapping that makes weather data easy to swap in.
Units and locale are render-time concerns, not data concerns
Notice the markup builds temperature strings as d.hi + '°' rather than baking a unit into the stored number. That separation matters because units and locale are display decisions, not data: the same CURRENT/FORECAST shapes work whether you're showing Celsius or Fahrenheit, you just convert (f = c * 9/5 + 32) at the point you format the string, ideally behind a single toDisplayTemp() helper so a unit toggle only touches one place. The same goes for day names — FORECAST[i].day is currently a static label ("Tue", "Wed"); a real integration would derive it from each forecast entry's date with Intl.DateTimeFormat, so the card automatically shows day names in the visitor's locale instead of a hardcoded English string.
Build with AI
Build, Understand, Optimize, and Extend It With AI
Ask an AI coding assistant like Claude to explain why ICONS and LABELS are separate lookup objects keyed by a condition code rather than the forecast array storing an emoji directly — that indirection is exactly the shape a real weather API integration needs, since providers return numeric or string codes rather than presentation-ready icons. It's also worth asking specifically what changes if you swap the hardcoded "Tue", "Wed" day labels for real dates formatted with Intl.DateTimeFormat in the visitor's own locale. For extending it, ask for an hourly forecast strip beneath the daily one, a gradient background that shifts based on the current condition code, or a unit toggle between Celsius and Fahrenheit that recomputes every displayed temperature from one stored value. Treat the code less like a finished artifact and more like a starting point for a conversation.
Prompt to recreate it
Copy this into your AI assistant of choice to build the effect from scratch, or as a jumping-off point for your own variant:
Build a weather forecast card in plain HTML, CSS, and JavaScript with prominent current conditions and a five-day outlook row, driven entirely by a code-to-presentation mapping — no library, no live API call required for the demo.

Requirements:
- Define two lookup objects keyed by short condition codes (such as sunny, partly, cloudy, rain, storm, snow) — one mapping each code to a display icon and one mapping each code to a human-readable label — and never hardcode an icon or label directly against a specific day; every day's presentation must be derived by looking up its code in these tables.
- A current-conditions header showing a large icon and temperature pulled from a single "current" data object, alongside the location name and a secondary block showing the condition label, a "feels like" temperature, humidity, and wind speed.
- A five-day forecast row built from an array of day objects (each with a day label, a condition code, and high/low temperatures), rendered as equal-width tiles with a translucent frosted-glass background over the card's gradient.
- Give the high temperature more visual weight (larger, bolder) than the low temperature within each day tile, and visually distinguish today's tile from the rest of the row.
- Build every temperature string by concatenating the raw numeric value with a degree symbol at render time rather than storing the unit inside the data itself, so the same data could later be displayed in either Celsius or Fahrenheit by converting only at the formatting step.
- Structure the code so that swapping the static current/forecast objects for the mapped, translated response of a real weather API requires no changes to the rendering functions — only to how those two data objects are populated.
Want to tighten it up first? Run this prompt through the AI Prompt Studio to score it across 8 quality dimensions, catch anti-patterns, and tune the wording for Claude, ChatGPT, or Gemini before you paste it in.
Step by step
How to Use
- 1Paste HTML, CSS, and JSA weather card renders with current conditions and a 5-day forecast row.
- 2Read the layoutThe large current temp and icon sit on top; the day tiles show icon and high/low below.
- 3Map your API codesTranslate your weather API's condition codes to the ICONS/LABELS keys (sunny, rain, etc.).
- 4Swap in your dataReplace CURRENT and FORECAST with your fetched values.
- 5Theme itChange the gradient and tile opacity, or drive the gradient from the condition.
- 6Extend the daysAdd more entries to FORECAST for a 7- or 10-day outlook.
Real-world uses
Common Use Cases
Got questions?
Frequently Asked Questions
Real weather APIs return condition codes (numbers or strings like "rain", "clear"), not icons. Keeping ICONS and LABELS lookup tables means you translate the API's codes to these keys once, and every icon and label on the card derives from the code. Hardcoding an emoji per day would make integrating a real API a rewrite; the mapping makes it a small translation step.
Fetch from your provider (OpenWeather, Open-Meteo, etc.), then map the response into the CURRENT object (temp, code, feels, humidity, wind) and the FORECAST array (day, code, hi, lo), translating the provider's condition codes into the ICONS/LABELS keys. Render from those shapes. All the presentation logic stays the same — only the data source and the code translation change.
Each day tile has a semi-transparent white background over the card's gradient plus backdrop-filter: blur, which frosts whatever is behind it — giving the modern weather-app glass look. Because the background is translucent, the tiles share the card's colour theme rather than looking like separate opaque boxes. backdrop-filter is supported in all current browsers (with a -webkit- prefix for older Safari).
Yes — the card uses a single gradient, but you could pick the gradient from the current condition code (a warm gradient for sunny, a grey one for cloudy, a deep blue for storms) by mapping codes to gradients the same way icons are mapped. Apply it to the card background in the render. The glass tiles work over any gradient, so condition-driven theming is a small addition.
Hold the current conditions and forecast in state, fetch and map your API into those shapes (and codes into icon keys) in a useEffect (React), onMounted (Vue), or ngOnInit (Angular), and render the header and day tiles from them. The code-to-icon mapping and layout are framework-agnostic — only the data fetching and state move into the framework.