More Dashboards Snippets
Front-End Coding Playgrounds
Learn to code with interactive, live-preview playgrounds — HTML, CSS, JavaScript, React & more.
 HTML Playground42 lessons · Click-based · Live preview
 CSS PlaygroundLearn CSS with a live editor
 JavaScript Playground60 lessons · DOM · Async · Canvas
 React PlaygroundLearn React with a live code editor
 GSAP PlaygroundLearn GSAP animation interactively
 SVG Playground44 lessons · shapes · paths · animation
 SCSS Playground45 lessons · Sass modules · tokens
 Tailwind PlaygroundLearn Tailwind CSS with a live editor
 Bootstrap 5 Playground50 lessons · live preview
Stats Card — Free HTML CSS JS Count-Up Snippet
Stats Card · Dashboards · Plain HTML, CSS & JS · Live preview
What's included
Features
About this UI Snippet
Stats Card — IntersectionObserver Count-Up, requestAnimationFrame Easing & Change Indicators
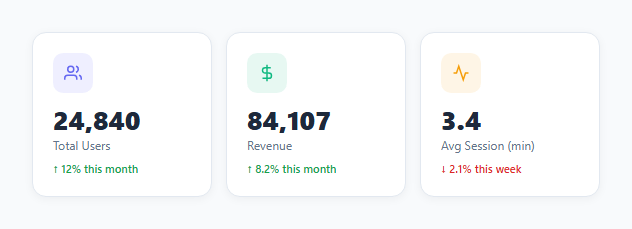
Stats cards display key metrics — revenue, user count, conversion rate, active sessions. They appear on every analytics dashboard, SaaS overview page, and marketing landing section. The difference between a static number and an animated count-up is significant: the animation draws the eye to the metric at the moment it enters the viewport, making the number feel earned rather than just displayed.
The IntersectionObserver trigger
Each .value element has a data-target attribute with the final number. The JavaScript creates an IntersectionObserver for each element. When the element enters the viewport (e.isIntersecting), animateValue(el) is called and the observer disconnects — the animation runs once and does not re-trigger on scroll back.
The count-up animation
animateValue(el) uses performance.now() as the animation start time and requestAnimationFrame for smooth updates. Each frame calculates progress p = Math.min((now - start) / 1200, 1) — a value from 0 to 1 over 1200ms. The easing function 1 - Math.pow(1 - p, 3) is a cubic ease-out: it starts fast and decelerates near the final value, like a car slowing to a stop. The eased progress multiplied by the target gives the current display value. For decimal targets, toFixed(1) is used; for integers, toLocaleString() adds commas.
Change indicators
Each card has a .change span with .up (green) or .down (red) and a delta value. The up/down classes control colour only — the emoji arrow is in the HTML. This makes it straightforward to wire real data: compare current vs previous period and set the class and delta dynamically.
Coloured icon backgrounds
Each card has an icon in a square with a coloured rounded background (.icon) tinted to match the metric type — purple for revenue, blue for users, green for conversion. Update the background and color inline styles on each .icon div to match your own metric categories.
The IntersectionObserver single-fire pattern
The stats card uses IntersectionObserver with threshold: 0.5. When 50% of the card enters the viewport, the count-up animation fires. Inside the callback, obs.disconnect() immediately unregisters the observer — the animation plays exactly once per page load, never re-triggering when the user scrolls back. This is the correct pattern for "animate once on enter" — not "animate every time on enter/exit".
The activity heatmap grid
The contribution heatmap generates a grid of day cells using JavaScript: for (let week = 0; week < 52; week++) { for (let day = 0; day < 7; day++) { ... } }. Each cell gets a colour intensity class based on its activity value (0–4). The CSS uses different background opacity levels per intensity class. The grid uses display: grid; grid-template-columns: repeat(52, auto); gap: 2px — 52 columns for 52 weeks.
SVG progress rings
The stats card uses multiple SVG progress rings at different sizes. Each ring has its own CIRCUMFERENCE (2πr) and target dashoffset. The rings animate simultaneously when the card enters the viewport — all starting from their empty state (dashoffset = CIRCUMFERENCE) and transitioning to their target value over 1s.
Build with AI
Build, Understand, Optimize, and Extend It With AI
You don't need to work out the easing math or the single-fire observer pattern by hand. Paste this snippet's HTML, CSS, and JS into an AI coding assistant like Claude and ask it to explain exactly how the cubic ease-out formula 1 minus (1 minus p) cubed produces deceleration rather than constant-speed counting, or why calling obs.disconnect immediately inside the intersection callback is what guarantees the animation plays exactly once instead of re-triggering every time the card scrolls back into view. The same assistant can help optimize it, for example checking whether creating a brand new IntersectionObserver instance per card (rather than one shared observer watching all of them) matters once there are many stat cards on a page. It's also useful for extending the feature: ask it to add a formatting option for compact numbers like 24.9k instead of full comma-separated digits, wire the up and down change indicators to real period-over-period API data instead of static text, or stagger multiple cards' count-up start times for a cascading reveal. Treat the code less like a finished artifact and more like a starting point for a conversation.
Prompt to recreate it
Copy this into your AI assistant of choice to build the effect from scratch, or as a jumping-off point for your own variant:
Build scroll-triggered count-up stat cards in plain HTML, CSS, and JavaScript, no framework, no libraries.

Requirements:
- Multiple cards, each containing an icon, a numeric value element carrying its final target number in a data attribute, a label, and a colored up or down change indicator with a percentage.
- For every element with a target data attribute, create a separate IntersectionObserver that watches only that element and, the moment it becomes intersecting, starts a count-up animation and immediately disconnects itself — the animation must play exactly once per page load and never re-trigger if the user scrolls the card out of view and back in.
- The count-up animation must use performance.now() to track elapsed time and requestAnimationFrame to update the displayed number every frame (not setInterval or a fixed number of steps), computing a progress fraction from 0 to 1 over a fixed duration.
- Apply a cubic ease-out curve to that progress fraction (one minus one-minus-progress raised to the third power) before multiplying it by the target value, so the count-up starts fast and decelerates smoothly into its final value rather than counting at a constant linear rate.
- Detect whether the target value is a whole number or has a decimal component, and format the displayed number accordingly during the animation: comma-separated whole numbers for integers, one decimal place for non-integer targets.
- Style the change indicators with distinct colors for positive and negative change classes, with the directional arrow character present in the markup rather than generated by JavaScript.
- The whole setup must automatically pick up any number of cards added to the page via a single querySelectorAll call, requiring no per-card JavaScript wiring.
Step by step
How to Use
- 1Scroll in the previewThe count-up animation fires when each card enters the viewport. Scroll to see the numbers count up from zero with cubic-ease deceleration.
- 2Update metric valuesIn the HTML panel, change the data-target attribute on each .value span to your real metric. The JS reads it automatically.
- 3Update labels and change indicatorsChange the .label text and the .change delta. Add class="up" for positive changes and class="down" for negative.
- 4Change icon coloursUpdate the background colour on each .icon div inline style to match your metric category colours.
- 5Adjust animation durationIn the JS panel, change 1200 (milliseconds) to speed up or slow down the count-up.
- 6Export in your formatClick "HTML" for a standalone file, "JSX" for a React component, or "Tailwind" for a React + Tailwind version.
Real-world uses
Common Use Cases
Got questions?
Frequently Asked Questions
animateValue() records the start time with performance.now(). Each requestAnimationFrame calculates p = Math.min((now - start) / 1200, 1) — progress from 0 to 1 over 1200ms. A cubic ease-out function (1 - Math.pow(1-p, 3)) applies deceleration. The eased value multiplied by the target gives the current number to display.
Scroll events fire dozens of times per second and require manual threshold calculation. IntersectionObserver fires once when the element crosses the threshold. obs.disconnect() after the first fire ensures the animation runs exactly once, even if the user scrolls back up.
Change the data-target attribute on each .value span in the HTML panel. The JS reads el.dataset.target as a float. For decimals (like 4.9), the animation uses toFixed(1). For integers, it uses toLocaleString() for comma formatting.
Copy a .card div and paste it in the HTML. Update the icon, data-target, label, and change values. The JS querySelectorAll("[data-target]") picks up any new elements automatically.
Fetch your metrics from an API and set each .value element's data-target attribute dynamically: el.dataset.target = yourValue. Then call animateValue(el) directly, or re-observe after the fetch if the cards are already in the viewport.
Yes. Click "JSX" to download a React component. In React, use a useRef on each value element and a useEffect with an IntersectionObserver. The count-up logic is identical — just wrap it in the effect callback and clean up the observer on unmount.