You Might Also Like
Learn Coding Visually
Learn to code with interactive, live-preview playgrounds — HTML, CSS, JavaScript, React & more.
 HTML Playground42 lessons · Click-based · Live preview
 CSS PlaygroundLearn CSS with a live editor
 JavaScript Playground60 lessons · DOM · Async · Canvas
 React PlaygroundLearn React with a live code editor
 GSAP PlaygroundLearn GSAP animation interactively
 SVG Playground44 lessons · shapes · paths · animation
 SCSS Playground45 lessons · Sass modules · tokens
 Tailwind PlaygroundLearn Tailwind CSS with a live editor
 Bootstrap 5 Playground50 lessons · live preview
Grouped Column Headers Table — Two-Level colspan Header (HTML CSS JS)
Grouped Column Headers Table · Tables · Plain HTML, CSS & JS · Live preview
What's included
Features
About this UI Snippet
Grouped Column Headers Table — Real colspan/rowspan for Multi-Level Headers
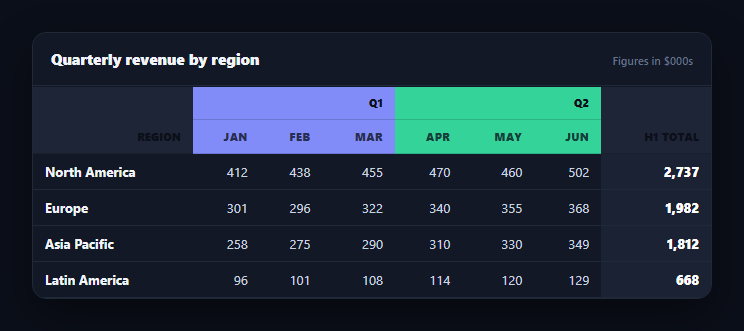
Wide tables with many related columns — months under quarters, metrics under categories — read better when a top header row groups them, and a second row labels each individual column. This snippet builds that grouped header the correct way: real colspan and rowspan attributes on actual <th> elements, not a second absolutely-positioned bar drawn over a flat header. The result is a table that's both visually grouped and structurally correct for screen readers and copy-paste into a spreadsheet.
Two real header rows, not one faked row
The <thead> contains two <tr> elements. The first row has a "Region" corner cell with rowspan="2" (so it spans both header rows without repeating), then a "Q1" <th colspan="3"> and a "Q2" <th colspan="3">, each covering exactly three of the six data columns, plus an "H1 Total" corner with rowspan="2". The second row supplies the six individual month labels. Because the browser's own table layout engine resolves the colspans, the group headers stay perfectly aligned with their columns at any width or font size — a visual-only overlay would drift the moment content reflows.
Why rowspan matters for the corner cells
The "Region" and "H1 Total" headers logically belong to *both* header rows (a single column, but the header block is two rows tall), so they're written once with rowspan="2" rather than duplicated. This is the detail that trips people up when hand-building grouped headers: without rowspan, the corner cells either repeat awkwardly or the columns miscount, because the browser expects every row in a table to describe the same number of column slots once spans are accounted for.
Semantically correct, not just visually grouped
Because this uses genuine table markup, a screen reader announcing a cell can trace it back through its header row to both "Q1" and "Feb," and selecting the table and pasting into Excel or Sheets reproduces the same grouped structure. A CSS-only fake header (a positioned bar with no real <th> relationship to the columns below it) loses all of that — it looks right but conveys nothing structurally and breaks on copy-paste or with assistive technology.
Color-coded groups for fast scanning
Each quarter's header cells and its underlying data columns share a tint (indigo for Q1, green for Q2), so a reader's eye groups the six month columns into two chunks before reading a single number — useful once you have more than three or four related columns in a row.
Data-driven and generic
The body renders from a flat DATA array of region records; the MONTHS array drives which keys become columns and their total. Add a new quarter by adding a third grouped <th colspan="3"> and three more month keys — the rendering loop over MONTHS needs no other change. Pair this pattern with a pivot table when you need the grouping computed from raw records rather than pre-aggregated columns, or a sticky header table to keep a grouped header visible while scrolling a long report.
Build with AI
Build, Understand, Optimize, and Extend It With AI
Rather than guessing why a hand-rolled grouped header looks misaligned, paste this snippet's HTML, CSS, and JS into an AI coding assistant like Claude and ask it to explain exactly how colspan="3" on the Q1 and Q2 header cells keeps them aligned to three month columns each without any manual width math, and why rowspan="2" on the Region and H1 Total headers is necessary for the second header row's column count to line up correctly. The same assistant can help extend it — ask it to add a third grouping level (years above quarters), make the group headers themselves clickable to sort by that quarter's total, or generate the grouped <thead> markup dynamically from a nested config object instead of hand-written HTML. Treat the code less like a finished artifact and more like a starting point for a conversation.
Prompt to recreate it
Copy this into your AI assistant of choice to build the effect from scratch, or as a jumping-off point for your own variant:
Build a data table with a real two-level grouped column header in plain HTML, CSS, and JavaScript — no libraries.

Requirements:
- A <thead> with two real <tr> rows, not a single row with an overlay. The first row must contain a corner header cell using rowspan="2" (spanning both header rows, since it applies to one column), two or more group header <th> cells each using a genuine colspan attribute (e.g. colspan="3") to span multiple underlying data columns, and a trailing totals corner header also using rowspan="2".
- The second header row must contain one <th> per individual data column (e.g. six month labels split three-and-three under two quarter group headers), with no colspan/rowspan on these — they occupy exactly one column slot each.
- Verify the column count adds up correctly: the corner cell (1) + the group headers' combined colspans (e.g. 3+3=6) + the totals corner (1) in row one must equal the six individual column headers + the row head + the total cell accounted for in row two, so the browser doesn't misalign columns.
- Render the table body from a flat JavaScript array of row records (e.g. one per region, with a value per month), computing each row's total by summing its month values — do not hardcode the totals.
- Style the two quarter groups with distinct background tints on both their header cells and, optionally, their data columns, so a reader visually groups the six month columns into two chunks at a glance.
- Confirm resizing the container keeps the group headers aligned exactly over their spanned columns, since this relies on the browser's native table layout resolving the colspans rather than any manual positioning.
Want to tighten it up first? Run this prompt through the AI Prompt Studio to score it across 8 quality dimensions, catch anti-patterns, and tune the wording for Claude, ChatGPT, or Gemini before you paste it in.
Step by step
How to Use
- 1Paste HTML, CSS, and JSA revenue table renders with Q1/Q2 group headers spanning three month columns each.
- 2Inspect the header markupTwo real <tr> rows in <thead>, with colspan="3" on each quarter and rowspan="2" on the corner cells.
- 3Resize the panelGroup headers stay aligned to their columns because the browser's own table layout resolves the spans.
- 4Add a quarterAdd a third colspan="3" group header and three more month keys to MONTHS and each DATA row.
- 5Select and copySelect the table and paste into a spreadsheet — the grouped structure carries over.
- 6Swap in your dataReplace DATA and MONTHS with your own metrics and periods.
Real-world uses
Common Use Cases
Got questions?
Frequently Asked Questions
A positioned overlay only looks aligned — it has no real relationship to the columns beneath it, so it drifts on resize, breaks with different font sizes, and conveys nothing to screen readers or spreadsheet paste. Real colspan is resolved by the browser's own table layout engine, so the group header is always exactly as wide as the columns it spans, at any viewport width.
Those two headers apply to a single column but the header block is two rows tall. rowspan="2" lets one cell occupy both header rows for that column, rather than duplicating the label or leaving an empty cell. Without it, the browser would miscount the columns in the second header row relative to the first.
Yes — because the groups are real <th> elements with genuine colspan/rowspan relationships to the data cells below, assistive technology can associate each data cell with both its group header (e.g. "Q1") and its specific column header (e.g. "Feb"), which a CSS-only faked header cannot provide.
Add a new <tr> above the current first row with a single <th colspan="6"> (or however many columns the year spans) for the year label, using rowspan="1" since it's a new top row, and increase the rowspan on the Region and Total corner cells to 3 so they still span all three header rows.
Render the two <thead> rows from a config object describing each group's label and column count, and the body from your data array as here. The colspan/rowspan markup is framework-agnostic — only the loop that emits <th> elements moves into JSX/template syntax.