Source Code
<div class="grt-wrap">
  <div class="grt-bar">
    <h3>Expenses by category</h3>
    <button type="button" class="grt-toggle" id="grtToggle">Collapse all</button>
  </div>
  <table class="grt-table">
    <thead><tr><th>Item</th><th>Vendor</th><th class="grt-num">Amount</th></tr></thead>
    <tbody id="grtBody"></tbody>
    <tfoot><tr><td colspan="2">Grand total</td><td class="grt-num" id="grtGrand"></td></tr></tfoot>
  </table>
</div>*{box-sizing:border-box;margin:0;padding:0}
body{font-family:system-ui,-apple-system,sans-serif;background:#f1f5f9;min-height:100vh;display:flex;align-items:flex-start;justify-content:center;padding:32px 20px}
.grt-wrap{background:#fff;border-radius:14px;width:100%;max-width:600px;box-shadow:0 18px 44px rgba(15,23,42,.08);overflow:hidden}
.grt-bar{display:flex;align-items:center;justify-content:space-between;padding:16px 18px;border-bottom:1px solid #f1f5f9}
.grt-bar h3{font-size:15px;font-weight:800;color:#0f172a}
.grt-toggle{background:#f1f5f9;border:1px solid #e2e8f0;border-radius:8px;padding:6px 11px;font-size:12px;font-weight:700;color:#475569;cursor:pointer;font-family:inherit}
.grt-toggle:hover{background:#e2e8f0}
.grt-table{width:100%;border-collapse:collapse;font-size:13px}
.grt-table th{text-align:left;padding:11px 16px;background:#f8fafc;border-bottom:1px solid #e2e8f0;font-size:11px;font-weight:800;text-transform:uppercase;letter-spacing:.03em;color:#64748b}
.grt-num{text-align:right}
.grt-group{cursor:pointer;user-select:none}
.grt-group td{padding:11px 16px;background:#f1f5f9;border-bottom:1px solid #e2e8f0;font-weight:800;color:#0f172a}
.grt-group:hover td{background:#e9eef5}
.grt-caret{display:inline-block;width:0;height:0;border-left:5px solid #64748b;border-top:4px solid transparent;border-bottom:4px solid transparent;margin-right:9px;transition:transform .18s}
.grt-group.open .grt-caret{transform:rotate(90deg)}
.grt-gcount{font-weight:600;color:#94a3b8;font-size:11.5px;margin-left:7px}
.grt-gtotal{float:right;font-variant-numeric:tabular-nums}
.grt-item td{padding:10px 16px;border-bottom:1px solid #f1f5f9;color:#334155}
.grt-item td:first-child{padding-left:34px}
.grt-item td:last-child{text-align:right;font-weight:700;font-variant-numeric:tabular-nums}
.grt-item.hide{display:none}
.grt-table tfoot td{padding:13px 16px;font-weight:800;color:#0f172a;border-top:2px solid #e2e8f0;font-variant-numeric:tabular-nums}var ITEMS = [
{ group: 'Travel', item: 'Flight to Berlin', vendor: 'Lufthansa', amount: 420.00 },
{ group: 'Travel', item: 'Hotel — 3 nights', vendor: 'Marriott', amount: 540.00 },
{ group: 'Travel', item: 'Airport taxi', vendor: 'FreeNow', amount: 38.50 },
{ group: 'Software', item: 'Design tool seats', vendor: 'Figma', amount: 180.00 },
{ group: 'Software', item: 'CI minutes', vendor: 'GitHub', amount: 96.00 },
{ group: 'Meals', item: 'Team dinner', vendor: 'Trattoria', amount: 212.30 },
{ group: 'Meals', item: 'Client lunch', vendor: 'Sushi Bar', amount: 88.00 },
];
var body = document.getElementById('grtBody');
var toggleBtn = document.getElementById('grtToggle');
var money = function (n) { return '$' + n.toLocaleString(undefined, { minimumFractionDigits: 2, maximumFractionDigits: 2 }); };
// Build an ordered map of group → items.
function groupBy(list) {
var map = {};
list.forEach(function (it) { (map[it.group] = map[it.group] || []).push(it); });
return map;
}
function render() {
var groups = groupBy(ITEMS);
var html = '';
Object.keys(groups).forEach(function (g, gi) {
var items = groups[g];
var total = items.reduce(function (s, it) { return s + it.amount; }, 0);
html += '<tr class="grt-group open" data-group="' + gi + '">' +
'<td colspan="3"><span class="grt-caret"></span>' + g +
'<span class="grt-gcount">' + items.length + ' items</span>' +
'<span class="grt-gtotal">' + money(total) + '</span></td></tr>';
items.forEach(function (it) {
html += '<tr class="grt-item" data-group="' + gi + '">' +
'<td>' + it.item + '</td><td>' + it.vendor + '</td><td>' + money(it.amount) + '</td></tr>';
});
});
body.innerHTML = html;
var grand = ITEMS.reduce(function (s, it) { return s + it.amount; }, 0);
document.getElementById('grtGrand').textContent = money(grand);
}
body.addEventListener('click', function (e) {
var head = e.target.closest('.grt-group');
if (!head) return;
var gi = head.dataset.group;
var open = head.classList.toggle('open');
body.querySelectorAll('.grt-item[data-group="' + gi + '"]').forEach(function (row) {
row.classList.toggle('hide', !open);
});
});
var allOpen = true;
toggleBtn.addEventListener('click', function () {
allOpen = !allOpen;
toggleBtn.textContent = allOpen ? 'Collapse all' : 'Expand all';
body.querySelectorAll('.grt-group').forEach(function (h) { h.classList.toggle('open', allOpen); });
body.querySelectorAll('.grt-item').forEach(function (r) { r.classList.toggle('hide', !allOpen); });
});
render();Learn Coding Visually
Learn to code with interactive, live-preview playgrounds — HTML, CSS, JavaScript, React & more.
 HTML Playground42 lessons · Click-based · Live preview
 CSS PlaygroundLearn CSS with a live editor
 JavaScript Playground60 lessons · DOM · Async · Canvas
 React PlaygroundLearn React with a live code editor
 GSAP PlaygroundLearn GSAP animation interactively
 SVG Playground44 lessons · shapes · paths · animation
 SCSS Playground45 lessons · Sass modules · tokens
 Tailwind PlaygroundLearn Tailwind CSS with a live editor
 Bootstrap 5 Playground50 lessons · live preview
Grouped Rows Table — Collapsible Group HTML CSS JS
Grouped Rows Table · Tables · Plain HTML, CSS & JS · Live preview
What's included
Features
About this UI Snippet
Grouped Rows Table — Collapsible Category Groups with Subtotals & Grand Total
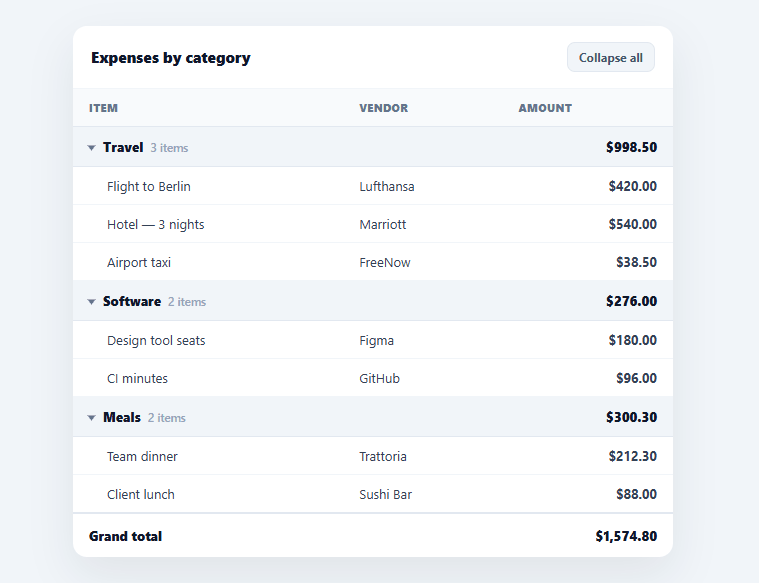
When a table's rows fall into natural categories — expenses by type, tasks by project, sales by region — grouping them with collapsible headers and subtotals turns a long flat list into a scannable, summarisable report. This snippet builds that grouped table in plain HTML, CSS, and vanilla JavaScript: rows clustered under category headers, each header showing a count and subtotal, individually collapsible with a caret, plus expand/collapse-all and a grand total — no library.
Grouping flat data into sections
The data is a flat ITEMS array where each row carries a group field. groupBy() folds that into an ordered map of group → rows, and the renderer emits a header row for each group followed by its item rows. Keeping the source flat (rather than pre-nested) is deliberate: it's the shape data actually arrives in from an API or database, and grouping in the view means you can regroup by a different field just by changing the key — without restructuring your data.
Headers that summarise
Each group header shows the category name, the number of items in it, and the group's subtotal (a reduce over its rows). Surfacing the subtotal on the header is what makes the grouping valuable — a reader can collapse every group and still see the totals per category, turning the table into a summary. A grand total in the table footer sums every row regardless of collapse state, so the bottom line is always correct.
Per-group and global collapse
Clicking any header toggles just that group: a caret rotates and the group's item rows get a hide class. The click is handled by one delegated listener on the table body via closest('.grt-group'), and rows are matched to their header by a shared data-group index — so collapsing is robust even as groups are added or reordered. A toolbar button collapses or expands *all* groups at once, flipping every caret and row together, which is the control people reach for on a table with many sections.
Indentation and alignment that read as a hierarchy
Item rows are indented under their header, amounts are right-aligned with tabular figures so they form a clean column, and the header subtotal floats to the same right edge — so subtotals and line items line up vertically into a proper financial-report layout. These alignment details are what make a grouped table read as a structured document rather than a striped list.
Data-driven and drop-in
Everything derives from the ITEMS array and its group field, so swapping in your data — or grouping by a different property — is a one-line change. Because it's dependency-free, it drops into any dashboard, expense report, or admin panel, and it's a clear reference for view-layer grouping, per-group aggregation, and delegated collapse handling.
Build with AI
Build, Understand, Optimize, and Extend It With AI
You don't have to trace the delegated click handling by hand. Paste this snippet's HTML, CSS, and JS into an AI coding assistant like Claude and ask it to explain exactly how the shared data-group index links a header row to its item rows through the closest lookup, or why groupBy folds a flat ITEMS array instead of expecting pre-nested data. The same assistant is useful for optimizing it — ask whether re-rendering the entire tbody via innerHTML on every toggle is wasteful for a table with hundreds of rows, and what a targeted class-toggle approach would look like instead. It is just as handy for extending the table: ask it to add per-group sorting, a search box that filters items while keeping group subtotals accurate, or persisted collapse state in localStorage. Treat the code less like a finished artifact and more like a starting point for a conversation.
Prompt to recreate it
Copy this into your AI assistant of choice to build the effect from scratch, or as a jumping-off point for your own variant:
Build a table with collapsible grouped rows in plain HTML, CSS, and JavaScript — no library, no framework.

Requirements:
- Accept a flat array of row objects, each carrying a group field alongside its other fields (item name, vendor, amount).
- Write a groupBy function that folds the flat array into an ordered map of group name to its rows, preserving first-seen group order.
- Render one header row per group showing the group name, the count of items in it, and a subtotal computed with reduce over that group's rows, immediately followed by one row per item indented under it.
- Give each header row and its item rows a shared data-group index so they can be matched without relying on DOM adjacency.
- Use a single delegated click listener on the table body (not one listener per header) that finds the clicked header via closest, toggles an "open" class on it to rotate a CSS caret, and toggles a "hide" class on every item row sharing that data-group index.
- Add a toolbar button that collapses or expands every group at once by toggling the same classes on all headers and items in one pass.
- Add a table footer that always sums every row's amount into a grand total, regardless of which groups are currently collapsed.
- Right-align and use tabular-nums formatting for all monetary values so subtotals and the grand total form a clean vertical column.
Want to tighten it up first? Run this prompt through the AI Prompt Studio to score it across 8 quality dimensions, catch anti-patterns, and tune the wording for Claude, ChatGPT, or Gemini before you paste it in.
Step by step
How to Use
- 1Paste HTML, CSS, and JSAn expenses table renders with rows grouped under category headers showing counts and subtotals.
- 2Collapse a groupClick any category header to collapse or expand just that group; the caret rotates.
- 3Collapse or expand allUse the toolbar button to fold or unfold every group at once.
- 4Read the totalsEach header shows its subtotal and the footer shows the grand total across all rows.
- 5Swap in your dataReplace the ITEMS array; each row's group field determines its section.
- 6Regroup by another fieldChange groupBy to key on a different property to group by region, project, etc.
Real-world uses
Common Use Cases
Got questions?
Frequently Asked Questions
Data usually arrives flat from an API or database — a list of rows, each tagged with a category. groupBy() folds that flat list into sections at render time, which means you can regroup by a different field just by changing the key, with no change to your underlying data. Pre-nesting would lock you into one grouping and complicate updates.
One delegated click listener on the table body catches clicks on any header via closest('.grt-group'). It toggles an open class (which rotates the caret) and adds/removes a hide class on every item row sharing that header's data-group index. Matching rows by index rather than DOM position keeps collapsing correct even as groups are added or reordered.
No — collapsing is purely visual. The grand total in the footer is computed once from every row in the data, and each group's subtotal is computed from its own rows, both independent of collapse state. So you can fold every group and still read accurate per-category subtotals and a correct bottom line.
Change groupBy to key on the property you want — e.g. it.region or it.project instead of it.group — and update the data accordingly. The header rendering, subtotals, collapse logic, and grand total all work off whatever grouping the function produces, so switching the grouping dimension is a one-line change.
In React, group the data with useMemo and render headers/items from the grouped structure, tracking open groups in state; in Vue, use a computed grouped object with v-for and a reactive open map; in Angular, use a pipe or getter with *ngFor. The grouping and aggregation logic is framework-agnostic — only the collapse state and rendering move into the framework.