Source Code
<div class="wrap">
  <div class="lb-head">
    <h2 class="lb-title">Top Performers</h2>
    <div class="period-tabs">
      <button class="period active" onclick="setPeriod(this,'week')">Week</button>
      <button class="period" onclick="setPeriod(this,'month')">Month</button>
      <button class="period" onclick="setPeriod(this,'all')">All time</button>
    </div>
  </div>

  <div class="table-scroll">
    <table class="table">
      <thead>
        <tr>
          <th class="rank-col">Rank</th>
          <th>User</th>
          <th class="hide-sm">Streak</th>
          <th>Score</th>
          <th class="bar-col">Progress</th>
          <th class="change-col">Change</th>
        </tr>
      </thead>
      <tbody id="lb-body">
        <tr class="row top1">
          <td><div class="rank medal gold">1</div></td>
          <td><div class="user"><div class="av" style="background:linear-gradient(135deg,#f59e0b,#ef4444)">KW</div><div class="user-info"><span class="uname">Kim Walsh</span><span class="urole">Senior Dev</span></div></div></td>
          <td class="hide-sm"><span class="streak">🔥 14d</span></td>
          <td class="score">9,840</td>
          <td class="bar-col"><div class="bar-track"><div class="bar-fill" style="width:98%;background:linear-gradient(90deg,#f59e0b,#f97316)"></div></div></td>
          <td><span class="change up">+2</span></td>
        </tr>
        <tr class="row top2">
          <td><div class="rank medal silver">2</div></td>
          <td><div class="user"><div class="av" style="background:linear-gradient(135deg,#94a3b8,#64748b)">AJ</div><div class="user-info"><span class="uname">Alex J.</span><span class="urole">Full-Stack</span></div></div></td>
          <td class="hide-sm"><span class="streak">🔥 9d</span></td>
          <td class="score">9,210</td>
          <td class="bar-col"><div class="bar-track"><div class="bar-fill" style="width:91%;background:linear-gradient(90deg,#94a3b8,#64748b)"></div></div></td>
          <td><span class="change same">–</span></td>
        </tr>
        <tr class="row top3">
          <td><div class="rank medal bronze">3</div></td>
          <td><div class="user"><div class="av" style="background:linear-gradient(135deg,#b45309,#d97706)">SM</div><div class="user-info"><span class="uname">Sara M.</span><span class="urole">Designer</span></div></div></td>
          <td class="hide-sm"><span class="streak">🔥 7d</span></td>
          <td class="score">8,760</td>
          <td class="bar-col"><div class="bar-track"><div class="bar-fill" style="width:87%;background:linear-gradient(90deg,#b45309,#d97706)"></div></div></td>
          <td><span class="change up">+1</span></td>
        </tr>
        <tr class="row">
          <td><div class="rank">4</div></td>
          <td><div class="user"><div class="av" style="background:linear-gradient(135deg,#6366f1,#a78bfa)">RP</div><div class="user-info"><span class="uname">Raj P.</span><span class="urole">Backend</span></div></div></td>
          <td class="hide-sm"><span class="streak">🔥 5d</span></td>
          <td class="score">7,920</td>
          <td class="bar-col"><div class="bar-track"><div class="bar-fill" style="width:78%;background:#6366f1"></div></div></td>
          <td><span class="change down">-2</span></td>
        </tr>
        <tr class="row">
          <td><div class="rank">5</div></td>
          <td><div class="user"><div class="av" style="background:linear-gradient(135deg,#10b981,#0ea5e9)">MK</div><div class="user-info"><span class="uname">Maya K.</span><span class="urole">DevOps</span></div></div></td>
          <td class="hide-sm"><span class="streak">🔥 3d</span></td>
          <td class="score">6,540</td>
          <td class="bar-col"><div class="bar-track"><div class="bar-fill" style="width:65%;background:#10b981"></div></div></td>
          <td><span class="change up">+4</span></td>
        </tr>
      </tbody>
    </table>
  </div>
</div>
* { box-sizing: border-box; margin: 0; padding: 0; }
body { font-family: system-ui, sans-serif; background: #f8fafc; min-height: 100vh; padding: 32px 20px; }
.wrap { max-width: 700px; margin: 0 auto; }
.lb-head { display: flex; justify-content: space-between; align-items: center; margin-bottom: 16px; flex-wrap: wrap; gap: 12px; }
.lb-title { font-size: 20px; font-weight: 800; color: #0f172a; }
.period-tabs { display: flex; background: #f1f5f9; border-radius: 8px; padding: 3px; gap: 2px; }
.period { background: transparent; border: none; font-size: 12px; font-weight: 600; color: #64748b; padding: 5px 14px; border-radius: 6px; cursor: pointer; transition: background 0.15s, color 0.15s; }
.period.active { background: #fff; color: #0f172a; box-shadow: 0 1px 4px rgba(0,0,0,0.08); }
.table-scroll { overflow-x: auto; border-radius: 14px; box-shadow: 0 1px 8px rgba(0,0,0,0.07); }
.table { width: 100%; border-collapse: collapse; background: #fff; }
.table thead tr { background: #f8fafc; }
.table th { padding: 10px 14px; text-align: left; font-size: 11px; font-weight: 700; letter-spacing: 0.5px; text-transform: uppercase; color: #64748b; border-bottom: 1px solid #e2e8f0; }
.table td { padding: 12px 14px; font-size: 13px; border-bottom: 1px solid #f1f5f9; vertical-align: middle; }
.table .row:last-child td { border-bottom: none; }
.table .row:hover { background: #fafafa; }
@media (max-width: 520px) { .hide-sm { display: none; } }
.rank-col { width: 56px; }
.rank { width: 28px; height: 28px; border-radius: 8px; display: flex; align-items: center; justify-content: center; font-size: 12px; font-weight: 800; background: #f1f5f9; color: #475569; }
.medal { color: #fff; }
.gold { background: linear-gradient(135deg,#f59e0b,#f97316); box-shadow: 0 2px 8px rgba(245,158,11,0.4); }
.silver { background: linear-gradient(135deg,#94a3b8,#64748b); box-shadow: 0 2px 8px rgba(148,163,184,0.3); }
.bronze { background: linear-gradient(135deg,#d97706,#b45309); box-shadow: 0 2px 8px rgba(180,83,9,0.3); }
.top1 td { background: rgba(245,158,11,0.03); }
.top2 td { background: rgba(148,163,184,0.03); }
.top3 td { background: rgba(180,83,9,0.03); }
.user { display: flex; align-items: center; gap: 10px; }
.av { width: 32px; height: 32px; border-radius: 50%; color: #fff; font-size: 10px; font-weight: 800; display: flex; align-items: center; justify-content: center; flex-shrink: 0; }
.user-info { display: flex; flex-direction: column; }
.uname { font-size: 13px; font-weight: 700; color: #0f172a; }
.urole { font-size: 11px; color: #94a3b8; }
.streak { font-size: 12px; color: #64748b; white-space: nowrap; }
.score { font-size: 14px; font-weight: 800; color: #0f172a; font-feature-settings: "tnum"; white-space: nowrap; }
.bar-col { width: 100px; }
.bar-track { height: 6px; background: #e2e8f0; border-radius: 3px; overflow: hidden; }
.bar-fill { height: 100%; border-radius: 3px; transition: width 0.6s ease; }
.change-col { width: 60px; }
.change { font-size: 12px; font-weight: 700; padding: 3px 8px; border-radius: 6px; }
.up { background: rgba(34,197,94,0.1); color: #16a34a; }
.down { background: rgba(239,68,68,0.1); color: #dc2626; }
.same { background: #f1f5f9; color: #94a3b8; }function setPeriod(el, period) {
document.querySelectorAll('.period').forEach(b => b.classList.remove('active'));
el.classList.add('active');
// In production, fetch new data for the selected period
// For demo, just animate the bars
document.querySelectorAll('.bar-fill').forEach(bar => {
const current = parseFloat(bar.style.width);
bar.style.width = '0%';
setTimeout(() => { bar.style.width = current + '%'; }, 50);
});
}Learn Coding Visually
Learn to code with interactive, live-preview playgrounds — HTML, CSS, JavaScript, React & more.
 HTML Playground42 lessons · Click-based · Live preview
 CSS PlaygroundLearn CSS with a live editor
 JavaScript Playground60 lessons · DOM · Async · Canvas
 React PlaygroundLearn React with a live code editor
 GSAP PlaygroundLearn GSAP animation interactively
 SVG Playground44 lessons · shapes · paths · animation
 SCSS Playground45 lessons · Sass modules · tokens
 Tailwind PlaygroundLearn Tailwind CSS with a live editor
 Bootstrap 5 Playground50 lessons · live preview
Leaderboard Table — Free HTML CSS JS Snippet
Leaderboard Table · Tables · Plain HTML, CSS & JS · Live preview
What's included
Features
About this UI Snippet
Leaderboard Table — Medal Ranks, Progress Bars, Streak Counter & Period Tab Switcher
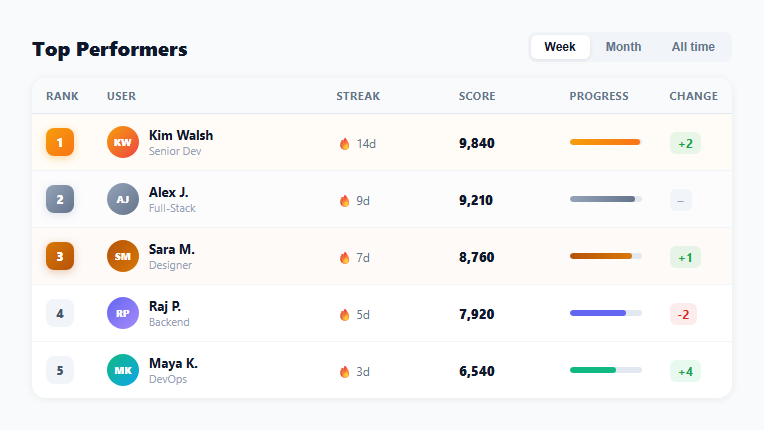
A leaderboard table ranks users, teams, or entities by a score metric — displaying position, identity, score, relative progress, and rank movement. Leaderboards are used in learning platforms, gamified apps, sales dashboards, fitness trackers, and developer community sites to drive engagement and competition. This snippet provides a complete leaderboard table with gradient medal badges, avatar initials, streak counters, score display, progress bars relative to the top score, rank change indicators, and a period tab switcher.
Medal rank badges
Ranks 1–3 use gradient medal badges: gold (amber → orange), silver (slate → grey), bronze (dark amber). Each uses background: linear-gradient with a matching box-shadow glow in the same colour. Ranks 4+ use a neutral grey background. The medal div is a fixed 28×28px square with border-radius: 8px for a rounded square shape — different from the circular avatar to maintain visual separation.
Progress bars relative to top score
Each row's progress bar width is set as a percentage of the top score (not 100%). Row 1 gets 98% (not 100% to avoid exact full-fill), row 2 gets 91%, and so on. Each bar uses a unique gradient matching the medal or avatar colour — creating colour-coded rows without repeating colours, the same fill technique as the standalone progress bar snippet. The bar transition: width 0.6s ease animates on the period tab switch.
Rank change indicators
The .change span shows +N (green), -N (red), or – (grey) for rank movement since the previous period. These use the same tinted background pattern as status badges elsewhere in the library.
Period tab switcher
Three tabs (Week, Month, All time) switch the data period. The active tab gets a white background on the grey tab container — the standard pill-style tab switcher pattern. In production, the tab click triggers an API fetch for the selected period and re-renders the table.
Score display
Scores use font-feature-settings: "tnum" (tabular numbers) so digits align vertically — a critical detail for numerical columns where values need to be visually compared across rows. Without tabular numbers, proportional digit widths cause misalignment in number columns.
Streak counter
A fire emoji + day count (🔥 14d) communicates daily engagement streaks. This is a lightweight gamification signal that is increasingly standard on learning and fitness platforms.
Build with AI
Build, Understand, Optimize, and Extend It With AI
You do not have to reverse-engineer the bar-fill math by reading the markup alone. Paste this snippet's HTML, CSS, and JS into an AI coding assistant like Claude and ask it to explain precisely why setPeriod() resets each bar-fill width to 0% before reapplying the stored width, and why row 1 is hardcoded to 98% rather than 100%. The same assistant can help optimize it, for instance asking whether font-feature-settings "tnum" is enough for numeric alignment across locales, or how to avoid a layout thrash if hundreds of rows animate their bar widths at once. It is also useful for extending the table: ask it to wire setPeriod to a real fetch call with a loading skeleton, add a sortable column click handler, or highlight the current signed-in user's row with a sticky footer. Treat the code less like a finished artifact and more like a starting point for a conversation.
Prompt to recreate it
Copy this into your AI assistant of choice to build the effect from scratch, or as a jumping-off point for your own variant:
Build a "leaderboard table" in plain HTML, CSS, and JavaScript with no libraries.

Requirements:
- A table with columns for rank, user (avatar initials plus name and role), a streak count, a numeric score, a progress bar relative to the top score, and a rank-change indicator (up, down, or unchanged).
- The top three rows must get distinct gold, silver, and bronze rounded-square medal badges (not circular avatars) built from CSS linear-gradient backgrounds with a matching colored box-shadow glow, plus a subtle tinted row background to set them apart from the rest of the table.
- Each row's progress bar width must be calculated as a percentage of the top scorer's score, capped at 98% even for the top row so no bar looks artificially maxed out, and each bar's fill color should be distinct per row rather than a single repeated color.
- The score column must use font-feature-settings: "tnum" so digits align vertically in a monospaced-number column regardless of proportional font metrics.
- Three period-switching tabs (e.g. Week, Month, All time) using a pill-style active state (white background on a light gray track). Clicking a tab must not fetch new data in this demo, but must re-trigger the bar-fill animation by resetting each bar's width to 0% and then back to its stored value on a short delay, so the CSS width transition visibly replays.
- A responsive rule that hides the streak column entirely below a defined breakpoint rather than shrinking it illegibly.
- Do not hardcode row count assumptions elsewhere in the JS — the period-switch bar animation logic must work against however many .bar-fill elements currently exist in the DOM.
Want to tighten it up first? Run this prompt through the AI Prompt Studio to score it across 8 quality dimensions, catch anti-patterns, and tune the wording for Claude, ChatGPT, or Gemini before you paste it in.
Step by step
How to Use
- 1Click the period tabs to see the bar animationClick Week, Month, or All time to trigger the bar width animation (bars drop to 0 then refill). In production, wire each tab to an API fetch that returns the ranked data for that period.
- 2Update user dataIn the HTML tbody, edit each row: change avatar initials, gradient colours, name, role, streak count, score, bar fill width percentage, and change indicator class (up/down/same) and value.
- 3Add or remove rowsDuplicate any table row pair in the tbody. Update the data-values and assign .top1/.top2/.top3 class only to the first three rows. Remove those classes from all others — the medal gradient and subtle row tint apply automatically.
- 4Calculate bar widthsSet each bar width as (score / topScore) * 100 + "%". Round to the nearest integer. The top scorer gets ~98% (not 100%) so the bar does not look artificially maxed out.
- 5Change the score label and period tabsUpdate the th "Score" header to your metric (Points, Revenue, Commits, Completions). Edit the three period button labels to match your time period options (Day/Week/Month, Sprint/Quarter/Year, etc.).
- 6Export in your formatClick "HTML" for a standalone file, "JSX" for a React component mapping a sorted data array to rows, or "Tailwind" for a React + Tailwind CSS version.
Real-world uses
Common Use Cases
Got questions?
Frequently Asked Questions
Divide each user's score by the top score and multiply by 100: const width = Math.round((score / topScore) * 100). Set this as the bar width percentage. Cap the top scorer at 98% (not 100%) so the bar does not appear artificially maxed: const width = Math.min(98, Math.round(score/topScore*100)). In a JavaScript-rendered table, compute this in the data mapping: rows.map((r,i) => ({...r, barWidth: Math.min(98, Math.round(r.score/rows[0].score*100))})).
Call your API on period tab click: fetch("/api/leaderboard?period=week").then(r=>r.json()).then(data => renderTable(data)). In renderTable, generate the table rows from the sorted data array: data.forEach((user, i) => { const rank = i+1; const tr = document.createElement("tr"); tr.innerHTML = ...; tbody.appendChild(tr); }). Clear the tbody before each render to prevent duplicate rows.
Compare each row's user ID to the current user ID: if (row.userId === currentUserId) { tr.classList.add("current-user"); }. In the CSS: .current-user td { background: rgba(99,102,241,0.05); } and .current-user .uname { color: #6366f1; font-weight: 800; }. Optionally add a "(You)" label after the name for unambiguous identification.
Click "JSX" to download. Accept a data prop: an array of {rank, name, role, score, streak, change, barWidth} objects sorted by score descending. Use useMemo to compute barWidth from scores. Manage activePeriod in useState. On period change, fetch new data and update the data state. Animate bars by setting a key on the table body that changes on data update, triggering a re-mount and re-animation.