Learn Coding Visually
Learn to code with interactive, live-preview playgrounds — HTML, CSS, JavaScript, React & more.
 HTML Playground42 lessons · Click-based · Live preview
 CSS PlaygroundLearn CSS with a live editor
 JavaScript Playground60 lessons · DOM · Async · Canvas
 React PlaygroundLearn React with a live code editor
 GSAP PlaygroundLearn GSAP animation interactively
 SVG Playground44 lessons · shapes · paths · animation
 SCSS Playground45 lessons · Sass modules · tokens
 Tailwind PlaygroundLearn Tailwind CSS with a live editor
 Bootstrap 5 Playground50 lessons · live preview
Conditional Formatting Table — Live Threshold Cell Coloring HTML CSS JS
Conditional Formatting Table · Tables · Plain HTML, CSS & JS · Live preview
What's included
Features
About this UI Snippet
Conditional Formatting Table — Cells Colored Live From Adjustable Thresholds
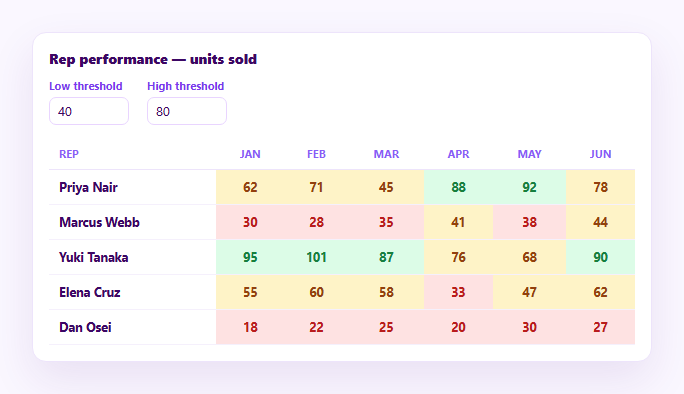
Spreadsheets have offered conditional formatting for decades because color is the fastest way to scan a grid of numbers for outliers — red for underperforming, green for exceeding target — without reading every value individually. This snippet reimplements that as a genuine live computation: a plain function maps each cell's numeric value to a color band based on two adjustable threshold inputs, and every cell recolors immediately whenever those thresholds change.
A pure value-to-color function, not precomputed classes
colorFor(value, low, high) takes a number and the two current threshold values and returns a background/foreground color pair with three plain if/return branches — below low is red, between low and high is amber, at or above high is green. Nothing about which cells are which color is baked into the markup or the data; every single cell's color is the live output of calling this function during render, which is what makes the thresholds genuinely adjustable rather than cosmetic.
Number inputs drive a full re-render
Two <input type="number"> controls hold the current low and high thresholds. Their input event (firing on every keystroke or spinner click, not just on blur) calls render(), which re-runs colorFor against every cell in the table with the new threshold values and rewrites the table body — so dragging or typing a new threshold recolors the entire grid live, the same way dragging a conditional formatting rule's threshold in a spreadsheet does.
A guard against an inverted range
If a user sets the high threshold below the low threshold, the three-band logic would produce a nonsensical or empty middle band. render() clamps high up to at least low before computing colors, so the bands always stay in a sane low ≤ middle < high order regardless of what the user types into the controls.
Style applied inline from computed values, not toggled classes
Because the color bands are threshold-driven rather than a small fixed set of states, each cell's background and text color are set directly via an inline style attribute built from colorFor's return value, rather than switching between a few predefined CSS classes — the right approach when the underlying value-to-color mapping is a continuous function of user-adjustable numbers rather than a small enum of fixed states.
Same function, every column
render() runs the identical colorFor call across every numeric column for every rep — there's no per-column special-casing, so adding a seventh month of data or changing which columns exist requires no changes to the coloring logic at all, only to the COLUMNS array driving which fields get rendered.
Customizing it
Add a third or fourth band with more granular thresholds, invert the direction (lower is better) with a toggle, or compute thresholds automatically from the dataset's own mean and standard deviation instead of fixed inputs. Pair with a multi-column sort table to sort by whichever month is currently most colored.
Build with AI
Build, Understand, Optimize, and Extend It With AI
Rather than reasoning through the threshold math on your own, paste this snippet's HTML, CSS, and JS into an AI coding assistant like Claude and ask it to explain exactly why colorFor is written as a pure function taking a value plus the two current threshold numbers, rather than precomputing a color for every cell once and storing it, and how that choice is what makes the coloring genuinely live rather than a fixed set of highlighted values. The same assistant can help you extend it — ask it to add a fourth color band for extreme outliers, compute thresholds automatically from the dataset's statistical mean and standard deviation instead of manual inputs, or add a legend that dynamically shows the current threshold values next to their color swatches. Treat the code less like a finished artifact and more like a starting point for a conversation.
Prompt to recreate it
Copy this into your AI assistant of choice to build the effect from scratch, or as a jumping-off point for your own variant:
Build a "conditional formatting" numeric data table in plain HTML, CSS, and JavaScript with no library — cell background and text color are computed live from each cell's value against adjustable threshold controls, the way spreadsheet conditional formatting rules work.

Requirements:
- Write a pure function, e.g. colorFor(value, lowThreshold, highThreshold), that takes a numeric cell value and the two current threshold numbers and returns a color pair (background and foreground) based on which of three bands the value falls into: below the low threshold, between the two thresholds, or at/above the high threshold. This function must be the single source of truth for every cell's color — no color should be hardcoded or precomputed anywhere else.
- Add two number input controls on the page for the low and high thresholds, pre-filled with reasonable default values, and wire both to the input event (which fires on every keystroke and spinner click, not just on blur) so that changing either value triggers an immediate full re-render of the table.
- In the render function, guard against the high threshold being set below the low threshold by clamping high up to at least equal low before computing any colors, so the three bands never become inverted or nonsensical regardless of what a user types into the controls.
- Render a data table with one row per entity and several numeric columns (e.g. monthly figures), where every single cell's background and text color is set by calling colorFor with that cell's value and the current threshold state, applied as an inline style since the color is a computed continuous value rather than one of a small fixed set of CSS classes.
- Make sure the coloring logic works identically across every column with no per-column special-casing, so adding a new numeric column to the underlying data array requires no changes to the coloring function itself.
- Confirm changing either threshold input visibly and immediately recolors every affected cell across the entire table, not just the row or column nearest the control.
Want to tighten it up first? Run this prompt through the AI Prompt Studio to score it across 8 quality dimensions, catch anti-patterns, and tune the wording for Claude, ChatGPT, or Gemini before you paste it in.
Step by step
How to Use
- 1Paste HTML, CSS, and JSA sales rep performance table renders with cells colored red, amber, or green by value.
- 2Adjust the Low threshold inputEvery cell below the new low value immediately turns red; the table recolors live.
- 3Adjust the High threshold inputCells at or above the new high value turn green; values between the two turn amber.
- 4Set High below LowThe high value automatically clamps up to match low, keeping the three bands sane.
- 5Scan for outliersColors make it immediately obvious which reps are under or over target across months.
- 6Swap in your own data and columnsReplace REPS and COLUMNS — colorFor runs identically across every numeric column.
Real-world uses
Common Use Cases
Got questions?
Frequently Asked Questions
The color bands are driven by two continuously adjustable number inputs, not a small fixed set of states — colorFor computes an actual color value based on where a number falls between two arbitrary thresholds a user can change at any time. Toggling between a handful of predefined CSS classes works for a fixed number of states, but a threshold-driven function is more directly expressed by computing the style value itself in JavaScript and applying it inline.
Add another comparison branch to colorFor before the final return, e.g. if (value >= high * 1.5) return { bg: '#a7f3d0', fg: '#065f46' } for an "exceptional" band, checked before the regular at-or-above-high case — the render loop and every input control keep working unchanged since they only ever call colorFor and use whatever it returns.
Swap which branch returns red and which returns green in colorFor — the below-low branch would return the green color pair and the at-or-above-high branch would return red, since the function only decides which color a range gets, not which direction is "good." Everything else (the threshold inputs, the render loop) is unaffected.
Before rendering, calculate the dataset's mean and standard deviation (or a percentile) across all visible values, and set low/high to something like mean minus one standard deviation and mean plus one standard deviation instead of reading them from the input fields — colorFor itself doesn't need to change, since it only needs any two numeric thresholds passed in.
Keep colorFor as a pure, framework-independent function. Store the low and high threshold values in component state bound to two number inputs, and compute each cell's inline style (or CSS custom properties) by calling colorFor(value, low, high) during render — the function itself needs no changes since it takes plain numbers and returns a plain color pair.