You Might Also Like
Learn Coding Visually
Learn to code with interactive, live-preview playgrounds — HTML, CSS, JavaScript, React & more.
 HTML Playground42 lessons · Click-based · Live preview
 CSS PlaygroundLearn CSS with a live editor
 JavaScript Playground60 lessons · DOM · Async · Canvas
 React PlaygroundLearn React with a live code editor
 GSAP PlaygroundLearn GSAP animation interactively
 SVG Playground44 lessons · shapes · paths · animation
 SCSS Playground45 lessons · Sass modules · tokens
 Tailwind PlaygroundLearn Tailwind CSS with a live editor
 Bootstrap 5 Playground50 lessons · live preview
Sticky Summary Row — Pinned Totals Footer HTML CSS JS
Sticky Summary/Totals Row · Tables · Plain HTML, CSS & JS · Live preview
What's included
Features
About this UI Snippet
Sticky Summary Row — Pinned Totals Computed Live From Real Row Data
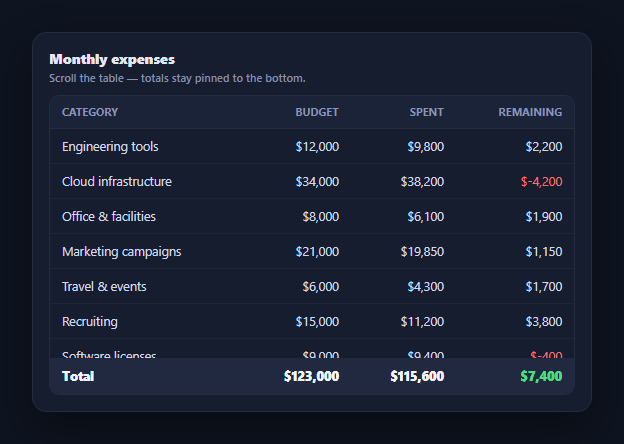
A totals row buried at the bottom of a long scrollable table is only useful the moment you happen to scroll all the way down to it — the rest of the time, the sums you actually want to reference while scanning the data are out of view. This snippet keeps the summary row pinned to the bottom of the visible scroll area at all times using genuine position: sticky, with every total computed live from the row data rather than typed in by hand.
A tfoot pinned with position: sticky, not a fixed overlay
The totals row lives in a real <tfoot>, and its cells get position: sticky; bottom: 0 within the scrolling container — the browser-native mechanism for pinning an element to an edge of its nearest scrolling ancestor. This is the vertical counterpart to a sticky header table, which pins the <thead> to top: 0 the same way; here it's the footer pinned to the bottom instead, so both ends of a long table can stay visible simultaneously while only the body scrolls between them.
Real aggregation, not a hardcoded row
computeTotals() runs a genuine Array.prototype.reduce over the live CATEGORIES array, summing the budget and spent fields across every row into a single accumulator object — nothing about the totals row's numbers is typed in directly. Change a value in the source data, add or remove a category, and the totals recompute correctly the next time this function runs, because they are a direct function of the actual rows, never a separately maintained number that could drift out of sync.
A derived total, not just two summed totals
The remaining-budget total isn't summed directly from a "remaining" field — it's derived as totals.budget - totals.spent after the two real column sums are already computed, matching how the per-row remaining values are themselves computed as budget - spent rather than stored. This keeps a single consistent definition of "remaining" used both per-row and in aggregate, so the footer's math always agrees with what you'd get by manually summing every row's own remaining column.
Elevated z-index so scrolling content passes beneath it cleanly
As body rows scroll past underneath the pinned footer, the summary row needs a higher z-index and an opaque background or scrolling rows would visibly show through it — set here alongside a distinct top border and heavier font weight so the summary row also reads visually as the "final word" on the data above it, not just another row.
Consistent styling logic between rows and the total
The negative-remaining highlight (a warning color when a category is over budget) uses the exact same conditional check in both the per-row loop and the summary computation — remaining < 0 — so the visual language for "over budget" is identical whether you're looking at one category or the aggregate across all of them.
Customizing it
Add an average alongside the sum, compute per-column totals generically by iterating column keys instead of naming each field, or combine with a virtualized table for a sticky summary over a very large scrolling dataset.
Build with AI
Build, Understand, Optimize, and Extend It With AI
Rather than working through the aggregation logic yourself, paste this snippet's HTML, CSS, and JS into an AI coding assistant like Claude and ask it to explain exactly why the summary row uses position: sticky with bottom: 0 inside a scrolling container rather than being placed outside the scrollable area entirely, and why computeTotals runs a real reduce over the row array instead of the totals being typed directly into the footer markup. The same assistant can help you extend it — ask it to make the totals computation generic across an arbitrary list of numeric columns instead of naming budget and spent explicitly, add an average row alongside the sum row, or combine this sticky-footer technique with a virtualized table where only a windowed slice of rows is ever in the DOM but the totals still need to reflect the complete underlying dataset, not just the currently rendered slice. Treat the code less like a finished artifact and more like a starting point for a conversation.
Prompt to recreate it
Copy this into your AI assistant of choice to build the effect from scratch, or as a jumping-off point for your own variant:
Build a data table with a sticky totals/summary row in plain HTML, CSS, and JavaScript with no library — the summary row must stay pinned to the bottom of the table's scrollable viewport while the body scrolls above it, and its numbers must be computed live from the actual row data.

Requirements:
- Structure the table with a real thead, tbody, and tfoot, and wrap it in a container with a fixed max-height and overflow-y: auto so the table body actually needs to scroll.
- Give the tfoot's cells position: sticky with bottom: 0 (within the scrolling container) so the summary row remains visible at the bottom of the visible area regardless of how far the user has scrolled through the body — this is the vertical counterpart to a sticky header pinned with top: 0, and both should work simultaneously in this table.
- Write a totals computation function that uses a real array reduce (or equivalent aggregation loop) over the actual array of row data objects to sum the numeric columns — do not hardcode or manually type the summary row's numbers anywhere in the markup or JavaScript.
- Derive any computed aggregate field (such as a "remaining" total calculated as total budget minus total spent) from the already-summed totals, using the same formula that produces each individual row's own derived value, so the aggregate and the per-row calculations stay logically consistent.
- Give the sticky summary row a higher z-index and an explicit opaque background color so that as body rows scroll underneath it, they do not visually show through the pinned totals row, and style it visually distinctly (e.g. bolder text, an accent top border) from ordinary data rows.
- Apply the same conditional formatting logic (e.g. a warning color when a value is negative or over some limit) consistently to both individual row cells and the corresponding aggregate cell in the summary row, using one shared comparison rather than two separately maintained checks.
- Confirm that adding, removing, or editing a row in the underlying data array and re-running the render correctly updates the totals with no other manual changes required.
Want to tighten it up first? Run this prompt through the AI Prompt Studio to score it across 8 quality dimensions, catch anti-patterns, and tune the wording for Claude, ChatGPT, or Gemini before you paste it in.
Step by step
How to Use
- 1Paste HTML, CSS, and JSAn eight-row expense table renders with a Total row already visible at the bottom.
- 2Scroll the table bodyThe Total row stays pinned to the bottom of the visible scroll area as rows pass beneath it.
- 3Check the numbersBudget, Spent, and Remaining totals are computed live from the actual row values via reduce.
- 4Edit a row's budget or spent valueThe totals recompute the next render — nothing about the summary is hand-typed.
- 5Add or remove a categoryThe totals update correctly to reflect exactly the rows currently in the data array.
- 6Watch an over-budget categoryIts Remaining value and the aggregate Remaining both use the same negative-value highlight.
Real-world uses
Common Use Cases
Got questions?
Frequently Asked Questions
As an ordinary last row, the summary would scroll out of view along with the rest of the body the moment you scroll down through a long table — exactly when a running total is most useful to have visible. position: sticky with bottom: 0 keeps it pinned to the bottom edge of the scrolling container regardless of how far the body has scrolled, the same mechanism a sticky header uses at top: 0.
Both approaches produce the same number here since subtraction distributes over the sum, but computing it from the already-summed budget and spent totals keeps a single definition of "remaining" (budget minus spent) used consistently everywhere, rather than maintaining what amounts to the same calculation in two separate places that could theoretically diverge if the formula ever changed in only one spot.
Inside computeTotals, alongside the running budget and spent sums, either divide the final sums by rows.length after the reduce completes, or accumulate a count and divide inside the reduce callback — then render an additional summary value using that computed average the same way the sums are rendered.
Instead of naming budget and spent explicitly in computeTotals, pass in an array of column keys to sum and use reduce with a loop over those keys (acc[key] = (acc[key] || 0) + row[key]) inside the reducer — this way adding a new numeric column to the row data only requires adding its key to the columns array, not editing the aggregation function itself.
Compute the totals with the same reduce logic inside a memoized calculation (useMemo, a computed property, or a getter) that re-runs when the underlying row data changes, and render the tfoot's sticky-positioned cells from that computed value — the CSS position:sticky behavior needs no JavaScript and ports unchanged into any framework's table markup.