You Might Also Like
Learn Coding Visually
Learn to code with interactive, live-preview playgrounds — HTML, CSS, JavaScript, React & more.
 HTML Playground42 lessons · Click-based · Live preview
 CSS PlaygroundLearn CSS with a live editor
 JavaScript Playground60 lessons · DOM · Async · Canvas
 React PlaygroundLearn React with a live code editor
 GSAP PlaygroundLearn GSAP animation interactively
 SVG Playground44 lessons · shapes · paths · animation
 SCSS Playground45 lessons · Sass modules · tokens
 Tailwind PlaygroundLearn Tailwind CSS with a live editor
 Bootstrap 5 Playground50 lessons · live preview
Meeting Scheduler Poll — Free HTML CSS JS Snippet
Meeting Scheduler Poll · Forms · Plain HTML, CSS & JS · Live preview
What's included
Features
About this UI Snippet
Meeting Scheduler Poll — Toggleable Time-Slot Grid With Heat-Colored Votes
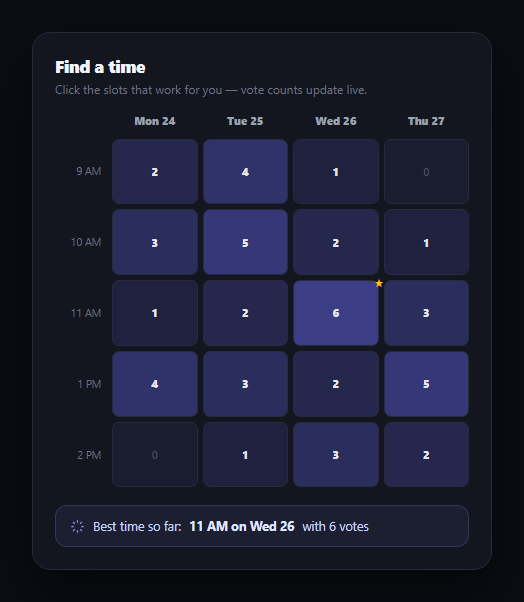
Scheduling a meeting across several people usually turns into an email thread of proposed times and half-answers. The meeting scheduler poll fixes that with the pattern popularized by When2meet and Doodle: lay out every candidate day and time as a grid, let people click the slots that work for them, and let the vote counts and color intensity do the summarizing. This snippet builds that grid in plain HTML, CSS, and vanilla JavaScript. Pair it with availability scheduler or poll widget for related scheduling and voting patterns.
A vote matrix, not a list
Votes are stored as a 2D array indexed by time row and day column — votes[timeIndex][dayIndex] — which mirrors exactly how the grid is laid out visually. This makes the mapping between data and UI direct: rendering is just iterating the same two dimensions the grid already has, and looking up "how many people are free Tuesday at 10am" is a single array access rather than a search.
Heat intensity instead of a bare number
Each cell's background opacity scales with its vote count relative to a configurable maximum, so the grid reads like a heatmap at a glance — busy, popular slots glow brighter without anyone needing to read every number individually. The exact count still sits inside the cell for precision, but the color does the first pass of communication, the same principle behind a heatmap matrix.
Toggleable, not just clickable
Clicking a cell adds your vote and marks it "picked" with a highlighted border; clicking it again removes your vote and un-marks it. This models the real behavior people expect from an availability poll — you're allowed to change your mind about a slot without leaving a phantom vote behind, and the visual "picked" ring makes it obvious which cells you personally have selected versus ones that are merely popular with others.
A summary that updates itself
findBest() scans the entire vote matrix on every render to find the single highest-voted slot, marks it with a star in the grid, and writes a one-line summary ("Best time so far: Tue 25 at 10 AM with 5 votes") beneath the grid. Because this recomputes from the live vote data every time, the summary can never fall out of sync with the grid — there's no separate "winner" state to update by hand.
Scaling it up
For a real poll, replace the static votes matrix with data fetched from your backend, and send each toggle as a vote/unvote request tied to the current user rather than mutating a shared array directly (so one person's clicks don't silently overwrite another's). The day/time labels, grid dimensions, and MAX_VOTES heat scale are all easy to make configurable for a longer scheduling window.
Build with AI
Build, Understand, Optimize, and Extend It With AI
You don't have to work out the heat-scaling or best-slot logic by hand. Paste this snippet's HTML, CSS, and JS into an AI coding assistant like Claude and ask it to explain exactly how the vote count is mapped to a background opacity to create the heatmap effect, and why findBest() recomputing from the live matrix on every render is what keeps the star marker and the summary text from ever disagreeing with the grid. The same assistant can help you optimize it — ask whether rebuilding every cell's DOM node on each render is necessary for a small grid like this versus patching just the changed cell. It's also useful for extending the poll: ask it to add per-person tooltips showing who voted for a slot, support a longer date range with horizontal scrolling, or persist votes to a backend so multiple real people can vote concurrently. Treat the code less like a finished artifact and more like a starting point for a conversation.
Prompt to recreate it
Copy this into your AI assistant of choice to build the effect from scratch, or as a jumping-off point for your own variant:
Build a "find a time" meeting scheduler poll in plain HTML, CSS, and JavaScript, in the style of When2meet/Doodle — no frameworks or libraries.

Requirements:
- Render a grid with days as columns and time slots as rows, where each intersection cell is clickable and shows a live vote count for that specific day/time combination, stored in a 2D data structure indexed the same way as the grid (time index, then day index) so data and layout stay directly mapped.
- Give each cell a background color whose intensity (opacity or lightness) scales continuously with its vote count relative to a configurable maximum, so the grid reads as a heatmap at a glance in addition to showing the exact number inside each cell.
- Make voting toggleable per cell: clicking an unvoted cell increments its count and visually marks it as "picked" by the current user (e.g. a highlighted border ring); clicking an already-picked cell decrements its count and removes the picked marking. A user must be able to pick any number of cells, not just one.
- Compute the single highest-voted cell fresh on every render by scanning the actual vote data (not a separately tracked "winner" variable), visually flag that cell in the grid (e.g. a small star), and show a one-line text summary below the grid naming that day, time, and vote count — falling back to a neutral "no votes yet" message when every cell is at zero.
- Visually distinguish zero-vote cells (e.g. a dimmed count) from cells with at least one vote, so an empty grid doesn't look identical to a lightly-voted one.
- Keep the grid dimensions and vote-count-to-heat scale as simple, easily changed constants so the poll can be extended to more days or time slots.
Want to tighten it up first? Run this prompt through the AI Prompt Studio to score it across 8 quality dimensions, catch anti-patterns, and tune the wording for Claude, ChatGPT, or Gemini before you paste it in.
Step by step
How to Use
- 1Paste HTML, CSS, and JSA 4-day by 5-time-slot grid renders with pre-seeded vote counts and heat colors.
- 2Click a slotYour vote is added, the cell brightens, and a highlighted ring marks it as picked.
- 3Click it againYour vote is removed and the ring disappears — you're free to change your mind.
- 4Watch the starThe current highest-voted slot gets a star marker in the grid.
- 5Read the summaryThe line below the grid always names the current best time and its vote count.
- 6Extend the gridChange DAYS, TIMES, or MAX_VOTES to fit a different scheduling window.
Real-world uses
Common Use Cases
Got questions?
Frequently Asked Questions
Each cell's background opacity is calculated from its vote count divided by a configurable MAX_VOTES ceiling, clamped to 1. A slot with zero votes is nearly transparent; one at or above MAX_VOTES renders at full intensity. This gives a continuous visual gradient rather than a few hard color buckets, so relative popularity is visible even between two moderately-voted slots.
Yes — clicking any slot toggles your vote on it independently of every other slot, and clicking a picked slot again removes just that vote. There's no limit on how many slots one person can mark as workable, which matches how real "find a time" polls are meant to be used: mark everything that could work, not just one preference.
findBest() iterates the entire votes matrix on every render and keeps the highest count it finds, defaulting to the first cell if every slot is tied at zero. Because this runs fresh each render rather than being tracked incrementally, the star marker and the summary text are always consistent with the actual current vote data.
Replace the local votes array with data fetched from your backend, and instead of mutating votes[t][d] directly in the click handler, send a vote/unvote request scoped to the current user and slot. On success, update the local matrix with the server's authoritative counts (or re-fetch) so concurrent voters don't silently overwrite each other's clicks.
Model votes as state (an array of arrays, or a flatter map keyed by "day-time"), and derive the heat color, the picked class, and the best-slot star from that state with computed values. Handle the click as a state update rather than direct array mutation and re-render declaratively — the grid layout and heat-color logic port over directly.