You Might Also Like
Learn Coding Visually
Learn to code with interactive, live-preview playgrounds — HTML, CSS, JavaScript, React & more.
 HTML Playground42 lessons · Click-based · Live preview
 CSS PlaygroundLearn CSS with a live editor
 JavaScript Playground60 lessons · DOM · Async · Canvas
 React PlaygroundLearn React with a live code editor
 GSAP PlaygroundLearn GSAP animation interactively
 SVG Playground44 lessons · shapes · paths · animation
 SCSS Playground45 lessons · Sass modules · tokens
 Tailwind PlaygroundLearn Tailwind CSS with a live editor
 Bootstrap 5 Playground50 lessons · live preview
Heatmap Matrix — Value Grid HTML CSS JS Snippet
Heatmap Matrix · Charts · Plain HTML, CSS & JS · Live preview
What's included
Features
0.08 + 0.92 × v/max, a simple perceptual "more colour = more value" scale with no config.aspect-ratio: 1 keeps cells square as the card resizes — no JavaScript measurement.show reads data-r/data-c/data-v and positions a tooltip with the exact value colour alone can't convey.rgba(...) strings, so they render identically across HTML, React, Vue, and Tailwind exports.ROWS/COLS/DATA, so any matrix size works without layout changes.About this UI Snippet
Heatmap Matrix — Intensity Cells, Row/Column Labels & Hover Tooltip
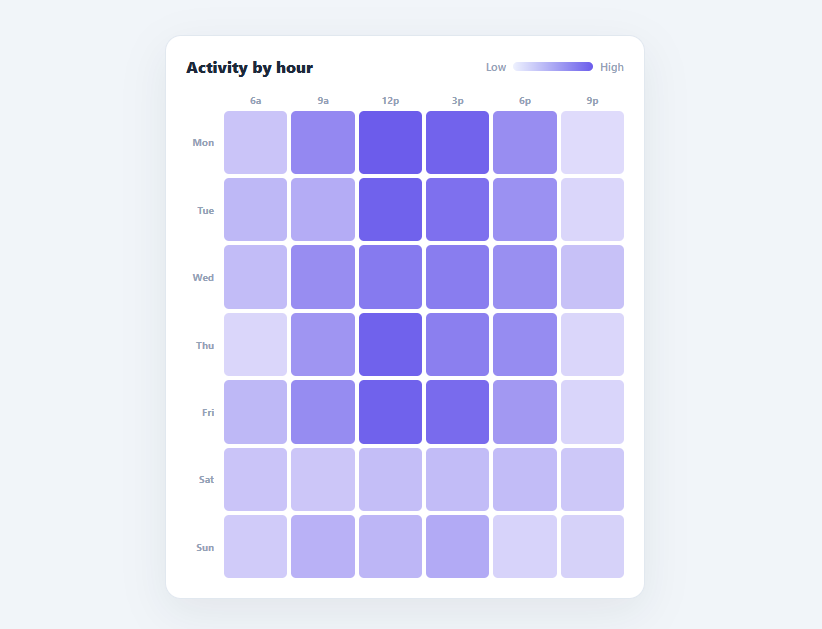
A heatmap matrix turns a two-dimensional table of numbers into a grid of colour, so patterns — busy hours, hot correlations, high-traffic cells — jump out instantly. Unlike a calendar heatmap, a matrix maps any rows against any columns (days × hours, products × regions, features × cohorts). This snippet builds one from a 2D array in plain HTML, CSS, and vanilla JavaScript: colour-scaled cells, row and column labels, a hover zoom with a tooltip, and a low-to-high legend.
Colour encodes value
build finds the maximum value across the whole matrix, then colours each cell with a single hue at an alpha proportional to its value (0.08 + 0.92 × v/max). Low values are nearly white, high values are saturated indigo — a perceptually simple "more colour = more value" scale that needs no legend to interpret, though one is provided. The cell's text colour flips to white above a contrast threshold so any in-cell labels stay legible on dark cells. Colours are written as literal rgba(...) inline styles, so they render identically across every framework export.
CSS Grid layout with labels
The matrix is a single CSS Grid: the first column is a fixed label track and the rest are equal fractions (34px repeat(n, 1fr)). The first row holds a blank corner plus the column labels; each subsequent row starts with its row label followed by the value cells. Cells use aspect-ratio: 1 so they stay square as the card resizes — no JavaScript sizing needed.
Hover zoom and tooltip
Each cell lifts and scales on hover (transform: scale(1.18) with a shadow and raised z-index), a tactile cue that also enlarges the cell you are inspecting. On mouseenter, show reads the cell's data-r/data-c/data-v attributes and positions a dark tooltip above it ("Wed 12p · 64 sessions"), giving the precise value that colour alone can only approximate. Leaving the plot hides the tooltip.
Data-driven and self-scaling
The whole grid derives from ROWS, COLS, and a 2D DATA array. A gen function fabricates a realistic pattern (busier midday, quieter weekends) for the demo; swap it for your real matrix and call build — the colour scale, labels, and grid columns all adapt to the new dimensions automatically.
Pair this with a stacked bar chart for composition, an activity heatmap for calendar-style data, or a metric card grid for headline numbers.
Build with AI
Build, Understand, Optimize, and Extend It With AI
You don't have to work out the color math by hand. Paste this snippet's HTML, CSS, and JS into an AI coding assistant like Claude and ask it to explain exactly how the alpha formula 0.08 plus 0.92 times v over max maps raw values onto a single-hue scale, or why the grid-template-columns string is rebuilt dynamically instead of hardcoded. The same assistant is useful for optimizing it — ask whether rebuilding the entire grid's innerHTML on every build call would scale to a much larger matrix, say fifty rows by fifty columns, or whether it should switch to canvas rendering at that size. It's just as handy for extending the heatmap: ask it to add a diverging two-color scale for signed data like correlations, support click-to-drill-down into a cell's time series, or add keyboard navigation between cells for accessibility. Treat the code less like a finished artifact and more like a starting point for a conversation.
Prompt to recreate it
Copy this into your AI assistant of choice to build the effect from scratch, or as a jumping-off point for your own variant:
Build a heatmap matrix in plain HTML, CSS, and JavaScript using CSS Grid — no canvas, no SVG, no charting library.

Requirements:
- Accept a row labels array, a column labels array, and a 2D array of numeric values with one row per row label and one value per column label.
- Compute the maximum value across the entire 2D array, then color every cell using a single hue whose alpha channel is 0.08 plus 0.92 times that cell's value divided by the max, written as a literal rgba(...) inline style (not a CSS variable or class lookup).
- Flip each cell's text color to white above a defined alpha/contrast threshold and keep it a dark gray below that threshold, so any in-cell label text stays legible regardless of background darkness.
- Lay the grid out as one CSS Grid whose first column is a fixed-width label track and remaining columns are equal fractions, with grid-template-columns built dynamically as a string from the column count (not hardcoded), a header row of column labels, and a leading row label before each row of value cells.
- Give every cell an aspect-ratio of 1 so cells stay square as the container resizes, without any JavaScript measuring their size.
- Attach a single mouseenter listener per cell that reads its row, column, and value from data attributes and positions a tooltip using the cell's offsetLeft/offsetTop/offsetWidth, hiding the tooltip on mouseleave from the plot container.
- Make the whole thing regenerate correctly if given a completely different-sized matrix (different row/column counts) with no other code changes.
Want to tighten it up first? Run this prompt through the AI Prompt Studio to score it across 8 quality dimensions, catch anti-patterns, and tune the wording for Claude, ChatGPT, or Gemini before you paste it in.
Step by step
How to Use
- 1Paste HTML, CSS, and JSAn "Activity by hour" card appears with a 7×6 grid of indigo cells, day labels down the left, hour labels across the top, and a low-to-high legend.
- 2Read the patternDarker cells mean more activity — midday weekdays glow strongest, weekends and early hours stay pale.
- 3Hover a cellIt zooms slightly and a tooltip shows the exact value ("Wed 12p · 64 sessions").
- 4Scan rows and columnsThe labels let you read any cell as a row × column intersection at a glance.
- 5Check the legendThe gradient bar maps the pale-to-saturated scale used by the cells.
- 6Plug in your dataReplace
ROWS,COLS, and thegendata with your matrix and callbuild; colours auto-scale to the new max.
Real-world uses
Common Use Cases
Got questions?
Frequently Asked Questions
Set ROWS and COLS to your labels and assign your 2D numbers to DATA (skip the gen generator), then call build. It computes the global max and recolours every cell, and gridTemplateColumns adapts to the number of columns — so any dimensions work without other changes.
For data centred on zero (e.g. correlations from −1 to 1), interpolate between two hues through white: map negative values toward one colour and positive toward another, with white at zero. Replace the single-hue alpha calc in build with an interpolation function that returns an rgb(...) based on the signed, normalised value, and update the legend gradient to match.
SVG/DOM cells are fine up to a few thousand. Beyond that, render to a Canvas (one fillRect per cell) for performance and overlay a single tooltip computed from the cursor's grid coordinates. For huge matrices, also consider virtualising rows so only visible cells exist in the DOM.
Colour alone is not accessible, so the tooltip exposes the exact value on hover, and you should add an aria-label per cell ("Wednesday 12pm, 64 sessions") plus a role="img" or an off-screen data table for screen-reader users. Ensure the scale is distinguishable for colour-blind users — a single-hue lightness ramp (as used here) is generally safe.
In React, compute the max with useMemo and render cells from your 2D array with inline rgba styles, tracking the hovered cell in useState for the tooltip — no manual DOM building. In Vue, use nested v-for with :style. In Angular, *ngFor with [style.background]. The colour math and grid CSS port unchanged.