You Might Also Like
Learn Coding Visually
Learn to code with interactive, live-preview playgrounds — HTML, CSS, JavaScript, React & more.
 HTML Playground42 lessons · Click-based · Live preview
 CSS PlaygroundLearn CSS with a live editor
 JavaScript Playground60 lessons · DOM · Async · Canvas
 React PlaygroundLearn React with a live code editor
 GSAP PlaygroundLearn GSAP animation interactively
 SVG Playground44 lessons · shapes · paths · animation
 SCSS Playground45 lessons · Sass modules · tokens
 Tailwind PlaygroundLearn Tailwind CSS with a live editor
 Bootstrap 5 Playground50 lessons · live preview
Horizontal Bar Chart — HTML CSS JS Ranking Bars
Horizontal Bar Chart · Charts · Plain HTML, CSS & JS · Live preview
What's included
Features
About this UI Snippet
Horizontal Bar Chart — Animated Ranking Bars Scaled to the Maximum Value
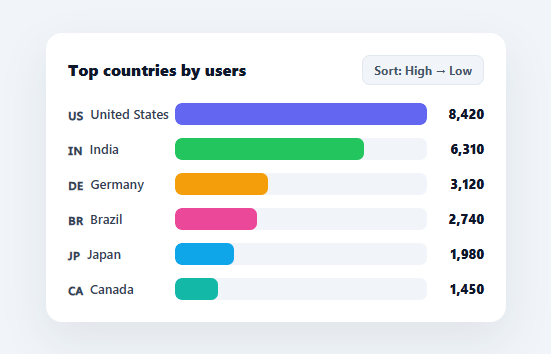
When you're comparing a list of named items — countries, products, referrers, team members — a horizontal bar chart reads far better than a vertical one: the labels sit on a tidy left column where they're easy to read, and the bars extend rightward in a natural ranking. This snippet builds that chart in plain HTML, CSS, and vanilla JavaScript, with animated fills, a sort toggle, and no charting library.
A CSS-grid row, not an SVG
Each row is a three-column CSS grid: a fixed-width label column, a flexible track that holds the bar, and a right-aligned value. Building bars as plain divs with a percentage width (rather than SVG rects) means the bars inherit border-radius, transitions, and gradients for free, wrap responsively, and need zero coordinate math. The track is a light rounded rail; the fill is a coloured bar clipped to it with overflow: hidden, so rounded corners stay crisp at any width.
Scaled to the maximum, animated from zero
Every bar's width is its value as a percentage of the largest value in the dataset, so the longest bar fills the track and the rest are proportional — the standard way to scale a bar chart for visual comparison. The fills start at width: 0 and animate to their target on the next animation frame; deferring the width assignment to requestAnimationFrame is the key trick that lets the CSS transition run, because setting the final width in the same tick the element is created would skip the animation entirely.
A sort toggle that re-ranks
A single button flips the sort between high-to-low and low-to-high, re-rendering the rows in the new order with the fills re-animating. Sorting works on a copy of the data (DATA.slice()) so the original order is preserved, and the max-value scaling stays consistent regardless of sort direction, so a bar represents the same width whether it's at the top or bottom of the list.
Labels that carry context
Each label pairs an emoji flag (or any icon) with the name, and a tabular-figures value sits at the end of the row so the numbers align vertically into a clean column — font-variant-numeric: tabular-nums keeps digits the same width so values don't jitter as they change. This three-part row (icon + name, bar, value) is the canonical "ranking list" layout you see in analytics dashboards everywhere.
Data-driven and drop-in
The whole chart renders from a DATA array of { label, flag, value, color }. Swap in your own ranked figures and the bars, scaling, sort, and values all follow. Because it's pure HTML/CSS/JS with no dependencies, it drops into any dashboard or report, and it's a clear reference for the percentage-of-max scaling and the requestAnimationFrame animation trick that apply to any bar visualisation.
Build with AI
Build, Understand, Optimize, and Extend It With AI
You don't have to work out the animation timing by hand. Paste this snippet's HTML, CSS, and JS into an AI coding assistant like Claude and ask it to explain exactly why the fill widths are set inside a requestAnimationFrame callback instead of directly in the template string, or how the percentage-of-max scaling stays consistent regardless of which sort order is active. The same assistant is useful for optimizing it — ask whether rebuilding the entire rows innerHTML on every sort toggle is wasteful compared to just reordering existing DOM nodes with a FLIP animation. It's just as handy for extending the chart: ask it to animate row reordering itself (not just fill widths) when the sort changes, add a search box that filters rows by label, or support negative values with bars extending left from a center zero line. Treat the code less like a finished artifact and more like a starting point for a conversation.
Prompt to recreate it
Copy this into your AI assistant of choice to build the effect from scratch, or as a jumping-off point for your own variant:
Build a horizontal ranking bar chart in plain HTML, CSS, and JavaScript using CSS Grid rows (not SVG, not canvas, no charting library).

Requirements:
- A data array of objects each with a label, an icon or flag emoji, a numeric value, and a color.
- Render each row as a three-column CSS grid: a fixed-width label column (icon plus name), a flexible track column containing the bar itself, and a right-aligned value column using tabular-nums formatting so digits align vertically down the column.
- Compute every bar's width as a percentage of the single largest value across the entire dataset (not just the currently visible sorted subset), so bar proportions stay meaningful regardless of sort order.
- Set every bar's width to 0 at creation, then apply the real target width percentage inside a requestAnimationFrame callback (not synchronously), so a CSS transition on width actually plays a grow-in animation from zero on every render.
- Add a single sort toggle button that flips between descending and ascending order, re-sorting a copy of the original data array (so the source array itself is never mutated) and re-rendering with the fills animating again from zero.
- Give the bar track rounded corners with overflow hidden so the colored fill inside always renders with matching rounded corners regardless of its width.
Want to tighten it up first? Run this prompt through the AI Prompt Studio to score it across 8 quality dimensions, catch anti-patterns, and tune the wording for Claude, ChatGPT, or Gemini before you paste it in.
Step by step
How to Use
- 1Paste HTML, CSS, and JSA ranked horizontal bar chart renders with six rows that animate their fills from zero.
- 2Toggle the sortClick the Sort button to flip between high-to-low and low-to-high; the rows re-rank and re-animate.
- 3Swap in your dataReplace the DATA array with your own { label, flag, value, color } items — scaling is automatic.
- 4Adjust the label columnChange the grid-template-columns label width if your names are longer or shorter.
- 5Restyle the barsEdit the fill colours, track colour, bar height, or border-radius to match your design.
- 6Wire to an APIFetch your figures, map them into the DATA shape, and call render() to draw the live chart.
Real-world uses
Common Use Cases
Got questions?
Frequently Asked Questions
Each bar's width is its value divided by the largest value in the dataset, times 100 — so the biggest item fills the track and every other bar is proportional to it. This percentage-of-max approach is the standard way to scale a bar chart for visual comparison, and it keeps bars consistent regardless of sort order because the max is computed from the full dataset, not the sorted slice.
A CSS transition only runs when a property changes between two rendered states. If you set the final width in the same tick the element is created, the browser never paints the 0 state, so there's nothing to animate from. Deferring the width assignment to requestAnimationFrame lets the element paint at width:0 first, then transition to its target — which is what produces the grow-in effect.
The button flips a desc boolean and calls render(), which sorts a copy of DATA (via DATA.slice()) rather than the original array. That keeps your source order intact for any other use while displaying the rows in the chosen direction. The max-value scaling is unaffected by sorting, so each bar's width stays the same wherever it lands.
Edit the DATA array — each entry is { label, flag, value, color }. Add, remove, or change entries and the rows, scaling, sort, and values all follow on the next render(). Swap the emoji flag for any icon or leave it out. For real data, fetch your figures, map them into that shape, and call render().
In React, hold the data and sort direction in useState and render the rows from .map(), setting widths in a useEffect so they animate after mount; in Vue, use v-for with a ref and onMounted; in Angular, use *ngFor with ngAfterViewInit. The scaling math and markup are framework-agnostic — only the state and the deferred width-set move into the framework.