You Might Also Like
Learn Coding Visually
Learn to code with interactive, live-preview playgrounds — HTML, CSS, JavaScript, React & more.
 HTML Playground42 lessons · Click-based · Live preview
 CSS PlaygroundLearn CSS with a live editor
 JavaScript Playground60 lessons · DOM · Async · Canvas
 React PlaygroundLearn React with a live code editor
 GSAP PlaygroundLearn GSAP animation interactively
 SVG Playground44 lessons · shapes · paths · animation
 SCSS Playground45 lessons · Sass modules · tokens
 Tailwind PlaygroundLearn Tailwind CSS with a live editor
 Bootstrap 5 Playground50 lessons · live preview
Crypto Price Ticker Card — Free Live Price UI with Sparkline
Crypto Price Ticker Card · Cards · Plain HTML, CSS & JS · Live preview
What's included
Features
About this UI Snippet
Crypto Price Ticker Card — Sparkline, Change Badge & Live Tick Flash
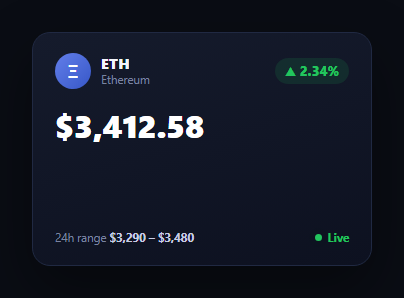
The crypto price ticker card is the compact asset display that shows up in wallets, exchanges, and dashboards: an icon, a symbol, a big price, a colored change badge, and a tiny trend line, all updating as new prices arrive. This snippet builds one entirely with vanilla JS and inline SVG — no charting library — and simulates a live feed with setInterval so you can see the flash-on-update behavior without wiring a real websocket.
A rolling price history array
A single history array holds the last 24 simulated prices. Every tick pushes a new price with a small random walk and shifts the oldest one off, so the array always represents a fixed trailing window — the same shape you'd maintain for a real feed, just fed by Math.random() instead of a websocket message handler.
The sparkline is a plain polyline, no chart library
The trend line is one <svg> with a single <polyline>. On every render, the history array is mapped to x,y coordinate pairs — x spread evenly across the viewBox width, y scaled between the window's min and max — and joined into the points attribute. This is the entire "chart": no dependency, no canvas, just a string of coordinates recalculated on each tick. It's the same technique used in sparkline chart and scales to any small trend indicator.
Change badge and line color both read the trend
The 24h change percentage compares the newest price against the oldest price still in the window, and a single up boolean drives three things at once: the badge's arrow and color, the badge's background tint, and the sparkline's stroke color. Keeping all three tied to one boolean means the card can never show a green badge next to a red line — a common bug when these are computed separately.
Flash highlight without restarting mid-flash
Each tick briefly adds a flash-up or flash-down class that tints the card's background, then removes it after the CSS transition finishes. Because ticks can arrive before the previous flash clears, the class is removed and a void card.offsetWidth forces a reflow before re-adding it — this restarts the CSS transition cleanly instead of it silently no-opping on an already-present class.
A live indicator that reads as "connected"
A small pulsing dot next to "Live" uses a CSS @keyframes box-shadow ping, independent of the price ticks — it communicates the feed is active even between updates, the same convention used for a live visitor counter or live currency ticker.
Wiring it to a real feed
Replace the tick() function's random walk with your websocket onmessage handler (or a polling fetch) — push the real price into history, shift if it exceeds the window length, and call render(prevPrice). Everything downstream — the sparkline, the badge, the flash, the range — already reacts to whatever is in history. Pair it with a wallet card or currency converter for a fuller portfolio view.
Build with AI
Build, Understand, Optimize, and Extend It With AI
You don't have to reason through the sparkline math on your own. Paste this snippet's HTML, CSS, and JS into an AI coding assistant like Claude and ask it to explain exactly how the rolling history array is mapped into SVG polyline coordinates, and why scaling y between the window's own min and max (rather than a fixed range) keeps the sparkline visually meaningful as the price drifts over time. The same assistant can help optimize it — asking whether the flash-restart technique using a forced reflow is the right approach if ticks can arrive faster than the CSS transition duration, or whether the change percentage should be computed against a true 24-hours-ago price instead of the oldest point in a rolling window. It's also useful for extending the card: ask it to add multiple assets in a scrollable list, wire tick() to a real websocket feed, or add a tap-to-expand state that reveals a larger chart. Treat the code less like a finished artifact and more like a starting point for a conversation.
Prompt to recreate it
Copy this into your AI assistant of choice to build the effect from scratch, or as a jumping-off point for your own variant:
Build a "crypto price ticker card" in plain HTML, CSS, and JavaScript with no library or CDN dependency.

Requirements:
- A card showing an asset icon, symbol, and name, a large current price, and a colored 24h change badge (green with an up arrow, red with a down arrow) driven by a single boolean so the badge and any trend indicator never disagree on direction.
- An inline SVG sparkline built from a single polyline element whose points attribute is recalculated from a fixed-length rolling array of recent prices — map each price to an x,y pair (x spread evenly across the viewBox width, y scaled between the window's own current min and max) — no canvas element and no charting library.
- Simulate a live feed with setInterval: every ~2 seconds, push a new price onto the history array using a small random walk, drop the oldest entry once the array exceeds a fixed window length, then re-render the price, change badge, sparkline, and a 24h min/max range readout.
- On every price update, briefly flash the card's background green or red depending on whether the price went up or down, and make sure the flash restarts cleanly even if a new tick arrives before the previous flash animation finished (hint: removing then re-adding the CSS class alone won't restart an in-progress transition — you need to force a reflow in between).
- Add a small independent "Live" indicator with a CSS-only pulsing dot animation that runs continuously regardless of the price ticks, to visually communicate the feed is connected.
- Use tabular/monospaced numeral styling on the price so digit changes don't cause horizontal jitter.
Want to tighten it up first? Run this prompt through the AI Prompt Studio to score it across 8 quality dimensions, catch anti-patterns, and tune the wording for Claude, ChatGPT, or Gemini before you paste it in.
Step by step
How to Use
- 1Paste HTML, CSS, and JSA single asset card renders with a starting price and a seeded 24-point history.
- 2Watch it tickEvery ~2.2 seconds the price updates, the sparkline redraws, and the card briefly flashes green or red.
- 3Read the change badgeIt compares the newest price to the oldest in the visible window and colors itself accordingly.
- 4Connect a real feedReplace tick()'s random walk with your websocket or polling handler that pushes real prices into history.
- 5Adjust the windowChange HISTORY_LEN to widen or narrow how much trailing history the sparkline shows.
- 6Style the assetSwap the icon gradient, symbol, and name for any asset — everything else adapts automatically.
Real-world uses
Common Use Cases
Got questions?
Frequently Asked Questions
The rolling history array is mapped to x,y coordinate pairs on every render — x spread evenly across the SVG viewBox width, y scaled between the window's current min and max — and joined into a single polyline's points attribute. There is no canvas and no dependency; it's a plain SVG element whose points string is recalculated each tick.
Replace the body of tick() with your websocket onmessage handler or a polling fetch. Push the new real price into the history array, shift() the oldest entry once it exceeds HISTORY_LEN, and call render(prevPrice) with the previous price for the flash comparison. Every other part of the card — sparkline, badge, range — already reacts to whatever is in history.
Toggling a CSS class that is already present does not restart its transition. The fix used here is to remove the class, force a synchronous reflow with void card.offsetWidth, then re-add the class — this guarantees the browser treats it as a fresh transition even if ticks arrive faster than the previous flash finished fading.
It compares the newest price (the last entry in the history array) against the oldest price still in the window (the first entry) as a percentage: (newest - oldest) / oldest * 100. Because history is a fixed-length rolling window, this approximates a trailing-window change rather than a true calendar-day change — swap in a stored 24h-ago price for exact accuracy.
Keep history in component state (a fixed-length array), update it on an interval or feed callback, and derive price, change percentage, and the polyline points string in a render/computed function. The SVG and CSS port unchanged; only the setInterval-driven mutation moves into the framework's state and lifecycle.