You Might Also Like
Learn Coding Visually
Learn to code with interactive, live-preview playgrounds — HTML, CSS, JavaScript, React & more.
 HTML Playground42 lessons · Click-based · Live preview
 CSS PlaygroundLearn CSS with a live editor
 JavaScript Playground60 lessons · DOM · Async · Canvas
 React PlaygroundLearn React with a live code editor
 GSAP PlaygroundLearn GSAP animation interactively
 SVG Playground44 lessons · shapes · paths · animation
 SCSS Playground45 lessons · Sass modules · tokens
 Tailwind PlaygroundLearn Tailwind CSS with a live editor
 Bootstrap 5 Playground50 lessons · live preview
AI Token Usage Meter — Free Prompt/Completion Usage Bar Snippet
AI Token Usage Meter · Dashboards · Plain HTML, CSS & JS · Live preview
What's included
Features
About this UI Snippet
AI Token Usage Meter — Segmented Prompt/Completion Bar with Live Warnings
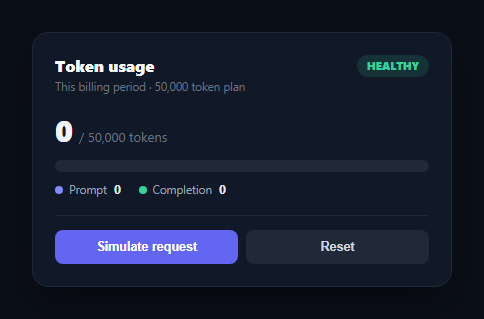
Any product billing by tokens — a chat app, an API platform, an IDE copilot — needs a way to show users how much of their allowance they've burned through before they hit a wall. This snippet builds a live token usage meter in plain HTML, CSS, and vanilla JavaScript: a segmented bar that splits usage into prompt tokens and completion tokens, a running counter, and a tiered warning state, all driven from two numbers.
Two segments, one bar
Most token-billed products separate prompt tokens (what you send) from completion tokens (what the model generates), often priced differently. Rather than two separate bars, render() draws both as adjacent segments of one track — tum-prompt in indigo, tum-completion in green — so the full picture of "where did my usage go" is visible in a single glance, with a small legend below reporting the exact split.
Simulate request, not a slider
Instead of a slider (which implies the user controls consumption directly), the demo exposes a "Simulate request" button that adds a randomized prompt/completion pair each click, the way a real request would land. This is closer to how token usage actually accrues — in discrete bursts from real calls — and makes the meter feel alive without needing a backend.
Tiered warning that changes the whole bar's color
Once total usage crosses 80% of the limit, both segments and the status badge shift from indigo/green to amber; at 100% they shift to red and a warning message appears explaining that requests may be throttled. The tier is computed once and applied everywhere — the badge, the bar segments, and the warning visibility — so nothing can disagree about the current state, the same pattern used in this library's quota usage meter.
Where this fits in an AI product
Place it in account settings next to an AI model comparison table so users understand both what a model costs and how much they've used, or pair it with an AI context window indicator — the usage meter tracks billing-period totals while the context indicator tracks the current conversation's window.
Customizing it
Swap the simulate button for a real event listener on your streaming response handler, wire LIMIT to the user's actual plan, and replace the random prompt/completion split with real numbers returned by your API's usage metadata.
Build with AI
Build, Understand, Optimize, and Extend It With AI
You don't have to work out the segmented-bar math by hand. Paste this snippet's HTML, CSS, and JS into an AI coding assistant like Claude and ask it to explain how the prompt and completion segment widths are computed independently so they always sum to the correct total percentage without overlapping or overflowing the track. The same assistant can help optimize it — ask whether accumulating usage in local state is sufficient or whether it should debounce writes to a backend on every simulated request. It's also useful for extending the meter: ask it to add a daily-reset countdown, animate the segments with a spring easing instead of a linear transition, or wire the simulate button to a real streaming response handler that reports actual token counts. Treat the code less like a finished artifact and more like a starting point for a conversation.
Prompt to recreate it
Copy this into your AI assistant of choice to build the effect from scratch, or as a jumping-off point for your own variant:
Build an "AI token usage meter" in plain HTML, CSS, and JavaScript with no framework or library.

Requirements:
- A card showing a large running total of tokens used against a fixed plan limit (e.g. 50,000 tokens), with the limit displayed both near the heading and next to the total.
- A single progress track split into two adjacent colored segments — prompt tokens and completion tokens — where each segment's width is computed independently as a percentage of the total limit, and the two segments must never visually overlap or together exceed 100% of the track width.
- A small legend below the bar reporting the exact prompt and completion token totals with color-matched indicator dots.
- A "Simulate request" button that, on each click, adds a randomized prompt token count and a larger randomized completion token count to the running totals (mimicking how usage actually accrues from real API calls in bursts, not via a slider the user drags).
- A tiered warning system: compute a single tier from total-usage-percentage (healthy under 80%, warning at 80-99%, over limit at 100%+), and use that one tier value to simultaneously control the bar segment colors, a status badge's color and text, and whether a warning message about possible throttling is shown — never set these independently.
- A reset button that zeroes both totals back to their starting state.
- Use a dark theme with system-ui font, tabular numbers for the counter, and smooth width transitions on the bar segments.
Want to tighten it up first? Run this prompt through the AI Prompt Studio to score it across 8 quality dimensions, catch anti-patterns, and tune the wording for Claude, ChatGPT, or Gemini before you paste it in.
Step by step
How to Use
- 1Paste HTML, CSS, and JSA dark "Token usage" card renders at 0 used against a 50,000 token limit.
- 2Click Simulate requestA randomized prompt/completion pair adds to the counter and the segmented bar fills.
- 3Watch the tiers changePast 80% the bar and badge turn amber; at 100% they turn red and a warning appears.
- 4Check the legendPrompt and completion totals report separately below the bar.
- 5Reset the demoClick Reset to zero out usage and try again.
- 6Wire up real dataReplace the simulate handler with your API's actual usage response.
Real-world uses
Common Use Cases
Got questions?
Frequently Asked Questions
Most token-billed AI products price prompt and completion tokens differently, and users often want to know which side of a request is driving their usage. Drawing them as adjacent segments of one track keeps the total usage readable at a glance while still exposing the split, with an exact breakdown in the legend below.
A slider implies the user directly controls how much they've used, which misrepresents how token billing actually works — usage accrues in discrete bursts from real API calls. The simulate button adds a randomized prompt/completion pair per click, mimicking that bursty accrual pattern more honestly than a continuous drag control.
A single tier() function classifies total usage as ok (under 80%), warn (80-99%), or over (100%+). That tier value drives the bar segment colors, the status badge, and whether the warning message is shown — all from one computed value, so they can never show conflicting states.
Replace the simulate button's random values with the actual prompt_tokens and completion_tokens your API returns per request (most LLM APIs include this in response metadata), accumulate them into promptUsed and completionUsed, and call render() after each request completes.
Track promptUsed and completionUsed as component state, derive the tier and segment widths with a computed value or useMemo, and call your update function whenever new usage data arrives from your API. The tier logic and markup structure port unchanged.