You Might Also Like
Learn Coding Visually
Learn to code with interactive, live-preview playgrounds — HTML, CSS, JavaScript, React & more.
 HTML Playground42 lessons · Click-based · Live preview
 CSS PlaygroundLearn CSS with a live editor
 JavaScript Playground60 lessons · DOM · Async · Canvas
 React PlaygroundLearn React with a live code editor
 GSAP PlaygroundLearn GSAP animation interactively
 SVG Playground44 lessons · shapes · paths · animation
 SCSS Playground45 lessons · Sass modules · tokens
 Tailwind PlaygroundLearn Tailwind CSS with a live editor
 Bootstrap 5 Playground50 lessons · live preview
Odometer Rolling Stat Counters — Free odometer.js Dashboard Snippet
Odometer Rolling Stat Counters · Dashboards · Plain HTML, CSS & JS · Live preview
What's included
Features
About this UI Snippet
Odometer Rolling Stat Counters — Mechanical Digit Rolls with odometer.js
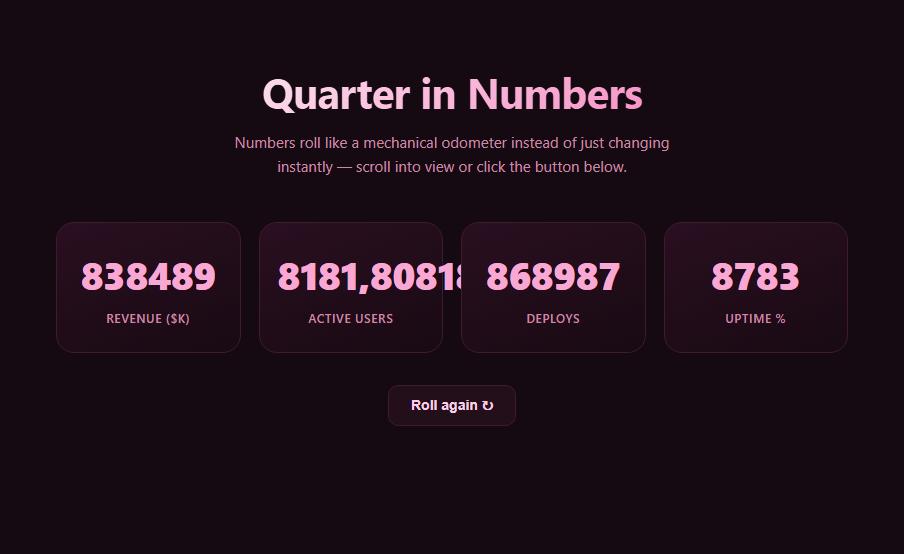
Odometer.js recreates the physical odometer effect — each digit spins independently on its own vertical reel until it lands on the new value — for arbitrary numbers on a web page. This snippet uses it to build a row of dashboard stat tiles that roll from zero to their real value the moment the grid scrolls into view, with a replay button to trigger the animation again on demand.
Odometer's API is the value itself
Unlike a typical animation library where you call something like .play() or .animate(), odometer.js works by intercepting how you update the element's value: once an element is wrapped with new Odometer({ el, value: 0 }), calling .update(newValue) — or, in odometer's classic usage, simply assigning to the underlying element's innerHTML — triggers the roll. The library replaces the element's content with a structure of individually-positioned digit reels, so setting a new value doesn't just swap text, it animates each digit to its new position on its own reel.
Triggering the roll on scroll
Rather than rolling on page load (which the visitor might miss if the stats are below the fold), this snippet wraps the four tiles in a single IntersectionObserver watching the .ost-grid container. Once it's roughly 40% visible, rollIn() fires once for all four odometers and the observer disconnects — this is the same "reveal once, on scroll" pattern used by Count Up and Number Ticker, just with odometer.js handling the actual digit animation instead of a manual requestAnimationFrame tween.
Independent digit reels
Because each digit rolls on its own reel rather than the whole number counting up as one unit, larger numbers (like the 15,230 active-users stat) look visually distinct from a typical linear count-up — the ones digit might cycle through several values while the ten-thousands digit only moves once. This is odometer.js's signature visual character and the reason to reach for it specifically over a generic number-tweening approach.
Theme CSS handles the visuals
The CDN's odometer-theme-minimal.css supplies the actual sliding/rolling visual mechanics (each digit as a small vertically-scrolling strip) — this snippet's own CSS only sets color, size, and weight so the digits match the surrounding dashboard palette. Odometer ships several built-in themes (minimal, car, digital, plaza, slot machine, train station) that can be swapped by simply linking a different theme CSS file.
Customizing it
Change Odometer.options.duration for a faster or slower roll, swap the theme stylesheet for a different visual style, or feed live values from an API instead of hardcoded targets. Pair this with Dashboard Widget Grid or Stats Card for a full metrics panel.
Build with AI
Build, Understand, Optimize, and Extend It With AI
You don't have to dig through odometer.js's internals to understand how it animates. Paste this snippet's HTML, CSS, and JS into an AI coding assistant like Claude and ask it to explain exactly what happens when odometers[id].update(value) is called — how the library computes per-digit differences and animates each reel independently — and why that produces a visually different effect than a single number counting up linearly. The same assistant can help you extend the demo — asking it to feed the odometers from a real API endpoint on an interval instead of static target values, add a currency prefix or percent suffix that doesn't itself roll, or stagger the four tiles' roll-in start times slightly instead of firing all four simultaneously. It's also useful for comparing approaches: ask when odometer.js's mechanical-digit visual is a better fit than a simpler count-up tween like the one used in Count Up. Treat the code less like a finished artifact and more like a starting point for a conversation.
Prompt to recreate it
Copy this into your AI assistant of choice to build the effect from scratch, or as a jumping-off point for your own variant:
Build a row of dashboard stat tiles whose numbers roll like a mechanical odometer using the odometer.js library (both its theme CSS and JS) loaded from a CDN — the rolling digit animation must come from the library itself, not a custom requestAnimationFrame count-up.

Requirements:
- A responsive grid of at least four stat tiles, each containing an element that will become an Odometer instance (starting at 0) and a label describing the metric (for example revenue, active users, deploys, uptime percentage).
- In JavaScript, construct a new Odometer instance for each tile's element with an initial value of 0, and set a shared Odometer.options.duration controlling roll speed for all instances.
- Do not roll the numbers to their real target values immediately on page load. Instead, use an IntersectionObserver watching the stat grid container, and only trigger every odometer's .update(targetValue) call once the grid is meaningfully visible (for example at a 0.4 intersection threshold), then disconnect the observer so it only fires once.
- Add a "replay" button that resets every odometer back to 0 via .update(0) and then, after a short delay, calls .update(targetValue) again so the roll-in animation can be watched repeatedly on demand.
- Style the tiles as dark-themed dashboard cards with the digits colored to match a cohesive palette, relying on the odometer theme CSS for the actual digit-rolling visual mechanics.
Want to tighten it up first? Run this prompt through the AI Prompt Studio to score it across 8 quality dimensions, catch anti-patterns, and tune the wording for Claude, ChatGPT, or Gemini before you paste it in.
Step by step
How to Use
- 1Add the Odometer CDN CSS and JSInclude the odometer-theme-minimal.css and odometer.min.js from the CDN panel.
- 2Paste HTML, CSS, and JSFour stat tiles and a replay button render, starting at 0.
- 3Scroll the tiles into viewEach digit rolls independently up to its target value.
- 4Click Roll againValues reset to 0, then roll back in after a short delay.
- 5Change the target valuesEdit the targets object in the JS panel with your real numbers.
- 6Swap the themeLink a different odometer theme CSS file for a new visual style.
Real-world uses
Common Use Cases
Got questions?
Frequently Asked Questions
Odometer wraps the target element and, on construction, replaces its content with a set of digit-reel elements. Calling .update(newValue) tells Odometer to compute the difference between the current and new digits and animate each reel to its new resting position — the animation is inherent to how the value change is applied, not a separate method you call afterward.
Rolling immediately on load risks the animation finishing before a visitor scrolls the stats into view, especially if the tiles sit below the fold. Watching the grid with an IntersectionObserver and rolling once it's roughly 40% visible ensures the visitor actually sees the digits animate, which is the entire point of using odometer.js instead of just rendering the final numbers.
Yes — call odometers[id].update(newValue) any time you receive fresh data, for example from a polling interval or a websocket message. Each call re-triggers the roll from the current displayed value to the new one, which is exactly the same mechanism used for the initial scroll-triggered roll-in.
Odometer ships several themes as separate CSS files (minimal, car, digital, plaza, slot machine, train station) — swap the odometer-theme-minimal.css CDN link for a different theme file's URL and the digit rendering changes without any JavaScript or HTML changes, since the theme purely controls the reel's visual presentation.
Install the odometer.js npm package (or keep the CDN scripts), and construct new Odometer({ el, value }) inside a mount effect (useEffect, onMounted, or ngAfterViewInit) targeting a ref to the digit container element. Call .update() whenever your component's underlying stat data changes, and keep the IntersectionObserver setup in the same effect with a matching cleanup that disconnects it on unmount.