You Might Also Like
Learn Coding Visually
Learn to code with interactive, live-preview playgrounds — HTML, CSS, JavaScript, React & more.
 HTML Playground42 lessons · Click-based · Live preview
 CSS PlaygroundLearn CSS with a live editor
 JavaScript Playground60 lessons · DOM · Async · Canvas
 React PlaygroundLearn React with a live code editor
 GSAP PlaygroundLearn GSAP animation interactively
 SVG Playground44 lessons · shapes · paths · animation
 SCSS Playground45 lessons · Sass modules · tokens
 Tailwind PlaygroundLearn Tailwind CSS with a live editor
 Bootstrap 5 Playground50 lessons · live preview
Live Delivery Route Tracker UI — Free HTML CSS JS Snippet
Live Delivery Route Tracker · Dashboards · Plain HTML, CSS & JS · Live preview
What's included
Features
About this UI Snippet
Live Delivery Route Tracker — SVG getPointAtLength Motion Path, ETA Countdown & Milestone Timeline
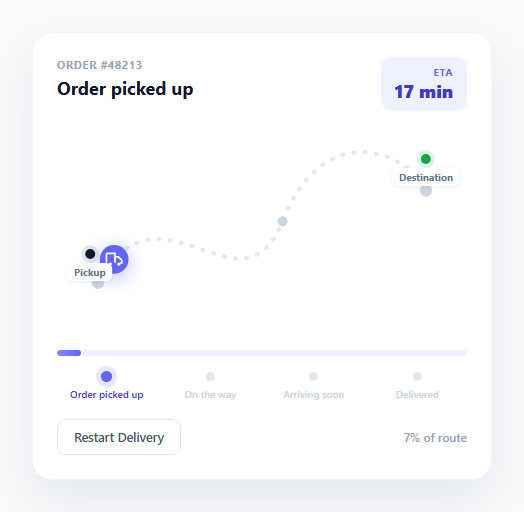
Every food delivery, ride-share, and e-commerce logistics app needs some version of the same widget: a visual representation of a vehicle moving from A to B, with a live estimate of when it will arrive. This snippet builds that widget from first principles using nothing but an SVG path, requestAnimationFrame, and the browser's native getPointAtLength() API — no mapping library, no external tile server, no dependency. The result is a stylized, illustrative route (not a literal map) that is fast to render, trivially themeable, and perfect for dashboards, order-confirmation screens, or marketing pages that want to show delivery progress without the weight of a real map SDK.
Why `getPointAtLength()` is the right tool for path-following animation
The core technical trick is SVG's SVGGeometryElement.getPointAtLength(distance) method, available on any <path> element. Given a distance travelled along the path (in user units, starting from 0 at the path's start), it returns the exact {x, y} coordinate at that point — including on curved segments defined by cubic Bezier C and smooth S commands. This means the vehicle icon can follow a genuinely curved, winding route without any manual interpolation math. The snippet first computes path.getTotalLength() once to get the path's full length in user units, then on every animation frame calculates a progress value between 0 and 1 (elapsed time divided by total trip duration) and calls getPointAtLength(progress * pathLength) to get the vehicle's current {x, y}. That coordinate is applied directly as a CSS transform: translate(x, y) on a <g> element nested inside the same SVG, so the vehicle marker glides smoothly along every curve of the dashed route line.
Driving the animation with requestAnimationFrame
Rather than a fixed-interval setInterval, the animation loop uses requestAnimationFrame, which self-schedules against the browser's repaint cycle for smoother, jank-free motion and automatically pauses when the tab is backgrounded. The loop records a startTime on the first frame, then on every subsequent frame computes elapsed = timestamp - startTime and derives progress = elapsed / DURATION_MS, clamped to a maximum of 1. This time-based (rather than frame-count-based) approach keeps the animation duration consistent regardless of the device's refresh rate — a 60Hz and 144Hz display both complete the trip in exactly DURATION_MS milliseconds.
Live ETA countdown and milestone status text
As progress advances, two more pieces of UI update in lockstep. The ETA pill recalculates remainingMin = Math.ceil(TOTAL_MIN * (1 - progress)), so the countdown ticks down in whole minutes as the trip proceeds and reads "Arrived" once progress reaches 1. Separately, a statuses array defines four milestones as { at: fraction, title: string } pairs — 0% "Order picked up", 8% "On the way", 78% "Arriving soon", 100% "Delivered". On each frame, setStatus() finds the highest milestone whose at threshold has been crossed and fades the status heading to that milestone's title using a brief opacity transition, while a horizontal milestone list highlights the current step and marks earlier steps as .done with a green dot.
Waypoints, progress bar, and restart control
Two intermediate SVG <circle> waypoints sit along the dashed path purely as visual landmarks, echoing how consumer delivery apps show waypoint dots between pickup and destination pins. Beneath the route, a slim progress bar mirrors the same progress value as a linear percentage, giving users a second, more literal read on how far along the delivery is. A "Restart Delivery" button resets startTime to null, cancels the in-flight animation frame, and re-triggers the full sequence from 0%, making the demo easy to replay. Because every visual is driven by one shared progress variable, the vehicle position, ETA, status text, milestone highlighting, and progress bar can never fall out of sync with each other.
Build with AI
Build, Understand, Optimize, and Extend It With AI
Paste this snippet's HTML, CSS, and JS into an AI coding assistant like Claude and ask it to trace exactly how getPointAtLength() converts a 0-to-1 progress fraction into pixel coordinates on the curved path, and how that single progress value simultaneously drives the vehicle position, the ETA text, the milestone highlighting, and the progress bar without any of them drifting out of sync. It's also a great snippet to ask an assistant to extend: request a version that accepts live progress updates from a WebSocket or polling API instead of a fixed timer, one that supports multiple simultaneous vehicles on the same path for a fleet dashboard, or one that adds a subtle route-completed celebration animation when the vehicle reaches the destination pin. Because the whole animation hinges on a handful of well-named variables (progress, pathLength, DURATION_MS), it's an approachable codebase to modify even for someone newer to SVG.
Prompt to recreate it
Copy this into your AI assistant of choice to build the effect from scratch, or as a jumping-off point for your own variant:
Build an animated delivery-route tracker widget in plain HTML, CSS, and JavaScript that shows a vehicle icon moving along a curved illustrative route with a live ETA and status updates — no map library or external API.

Requirements:
- Draw a stylized route as an SVG <path> using curved Bezier commands (not a straight line), with a start pin, an end pin, and at least one intermediate waypoint marker along the curve.
- Animate a vehicle icon so it follows the exact curve of the path using the path element's getPointAtLength() method combined with getTotalLength(), driven by a requestAnimationFrame loop rather than a fixed setInterval, so motion stays smooth and duration-accurate across different refresh rates.
- Show a live "ETA: N min" value that counts down proportionally as the vehicle's progress along the path increases, reaching a distinct "Arrived" state at 100% progress.
- Update a status heading through at least four milestones (for example picked up, on the way, arriving soon, delivered) at defined progress thresholds, with a smooth text transition when the status changes rather than an abrupt swap.
- Include a secondary linear progress bar and percentage label that stay in sync with the same underlying progress value driving the path animation.
- Provide a restart control that resets the animation to 0% and replays the full trip from the beginning, correctly canceling any in-flight animation frame first so restarts never double up.
- Make the SVG and layout responsive using a viewBox and relative sizing so the widget scales cleanly on mobile-width containers.
Want to tighten it up first? Run this prompt through the AI Prompt Studio to score it across 8 quality dimensions, catch anti-patterns, and tune the wording for Claude, ChatGPT, or Gemini before you paste it in.
Step by step
How to Use
- 1Watch the vehicle follow the routeOn load, startDelivery() kicks off a requestAnimationFrame loop that moves the vehicle marker along the dashed SVG path using getPointAtLength(). Watch the ETA pill count down and the status heading change as the marker crosses each milestone threshold.
- 2Restart the simulated tripClick "Restart Delivery" to reset progress to 0%, snap the vehicle back to the pickup pin, and replay the full animation from the "Order picked up" status through to "Delivered".
- 3Change the route shapeEdit the "d" attribute on #route-path in the HTML panel. It is a standard SVG path using M (move), C (cubic Bezier curve), and S (smooth curve) commands — getPointAtLength() will automatically follow whatever shape you draw, so you can make the route straighter, longer, or add more bends.
- 4Adjust trip duration and ETA minutesIn the JS panel, change TOTAL_MIN to set the starting ETA shown in minutes, and DURATION_MS to control how many real milliseconds the full animation takes to complete. These are independent — TOTAL_MIN is only used for the displayed countdown text.
- 5Customize milestone thresholds and copyEdit the statuses array in the JS panel — each entry has an at fraction (0 to 1) marking when that milestone becomes active and a title string. Add a fifth milestone by inserting a new { at, title } object; setStatus() automatically picks the correct one every frame.
- 6Restyle pins, vehicle, and accent colorThe vehicle halo and progress bar both use the #6366f1 accent color defined in .vehicle-halo and .progress-fill — change both to match your brand. Pin colors are set separately on .pin-dot and .pin-end .pin-dot for the start and destination markers.
Real-world uses
Common Use Cases
Got questions?
Frequently Asked Questions
getPointAtLength() is a native method on any SVG path element that the browser computes internally by walking the path's geometry — including cubic Bezier C and smooth S curve commands — and returning the exact {x, y} coordinate at a given distance from the path's start. You never have to manually calculate Bezier interpolation math; the browser handles it for any path shape, which is why this technique works identically whether your route is a straight line or a series of sweeping curves.
Yes. Replace the requestAnimationFrame loop's time-based progress calculation with a value fetched from your API, such as a percentage-complete field from a tracking webhook. Call the same rendering logic (getPointAtLength, ETA text update, setStatus) whenever new data arrives, for example inside a WebSocket message handler or a polling interval, instead of computing progress from elapsed animation time.
A real map requires a mapping SDK (Google Maps, Mapbox, Leaflet), an API key, network requests for tiles, and meaningfully more bundle weight and rendering cost. For many product surfaces — order confirmations, dashboard cards, marketing demos — users only need to feel reassured that movement is happening, not see literal street geography. A lightweight SVG path communicates that same sense of motion in a fraction of the code and loads instantly with zero external requests.
Change the DURATION_MS constant in the JS panel — it controls how many real milliseconds the full trip animation takes from 0% to 100% progress. A smaller value speeds up the animation; a larger value slows it down. This is independent of TOTAL_MIN, which only controls the number displayed in the ETA countdown text, so you can have a fast demo animation while still showing a realistic-looking "18 min" style estimate.
Yes. The SVG uses a viewBox with no fixed pixel dimensions, so it scales fluidly to its container width via the .route-wrap element's aspect-ratio: 400/200 rule. The card itself uses max-width: 100% so it shrinks gracefully on narrow viewports, and all text uses relative, legible font sizes that remain readable at typical mobile card widths.