You Might Also Like
Learn Coding Visually
Learn to code with interactive, live-preview playgrounds — HTML, CSS, JavaScript, React & more.
 HTML Playground42 lessons · Click-based · Live preview
 CSS PlaygroundLearn CSS with a live editor
 JavaScript Playground60 lessons · DOM · Async · Canvas
 React PlaygroundLearn React with a live code editor
 GSAP PlaygroundLearn GSAP animation interactively
 SVG Playground44 lessons · shapes · paths · animation
 SCSS Playground45 lessons · Sass modules · tokens
 Tailwind PlaygroundLearn Tailwind CSS with a live editor
 Bootstrap 5 Playground50 lessons · live preview
Rate Limit Status Panel — Free API Quota Dashboard Snippet
Rate Limit Status Panel · Dashboards · Plain HTML, CSS & JS · Live preview
What's included
Features
About this UI Snippet
Rate Limit Status Panel — Usage Ring, Reset Countdown, and Recent Request Log
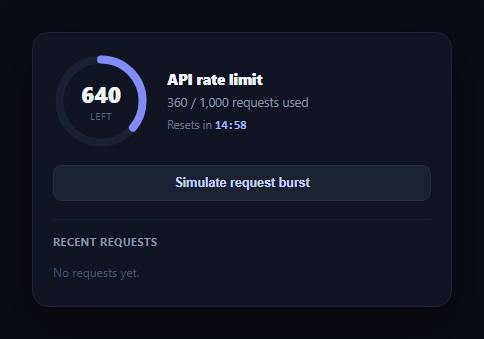
Every API product needs to show developers exactly where they stand against their rate limit — not after they get a 429, but continuously, so they can pace their own requests. This snippet builds that panel in plain HTML, CSS, and vanilla JavaScript: a circular usage ring, a live countdown to the next reset, a "simulate request burst" button, and a scrolling log of recent calls.
An SVG ring driven by stroke-dashoffset
The ring is a single SVG circle whose stroke-dasharray is fixed to its circumference and whose stroke-dashoffset is animated to reveal a proportional arc — the standard technique for a CSS/SVG progress ring with no canvas or chart library. The ring's color shifts from indigo to amber to red at the same 75%/95% thresholds used elsewhere in this snippet, so the ring, the request count, and the "requests used" text can never visually disagree.
A countdown that actually resets state
The reset countdown runs on a real one-second setInterval, and when it reaches zero, it wraps back to a fresh window (900 seconds here, standing in for a 15-minute rate-limit window) *and* zeroes the used-request count, mirroring how token-bucket and fixed-window rate limiters actually behave — the panel doesn't just show a countdown for show, it demonstrates the limit genuinely resetting.
Request burst simulation, not a slider
Like a real API workload, usage doesn't arrive smoothly — it comes in bursts (batch jobs, retries, background sync). The "Simulate request burst" button adds a randomized cluster of requests per click rather than one at a time, which is closer to how a developer would actually watch their limit climb, and each click also logs one representative endpoint call to the recent-requests list.
Where this fits in a developer product
Pair it with a webhook event tester so developers can both test their integration and watch their quota simultaneously, or place it next to an AI token usage meter — the rate limit panel tracks request *frequency* within a short window while the token meter tracks *volume* across a billing period, two related but distinct constraints on an AI API.
Customizing it
Replace the simulated burst with real request counts read from your API client's response headers (most APIs return X-RateLimit-Remaining and X-RateLimit-Reset), adjust the window length and limit to match your actual API, or add a second ring for a longer-period limit alongside this short-window one.
Build with AI
Build, Understand, Optimize, and Extend It With AI
You don't have to work out the SVG ring math by hand. Paste this snippet's HTML, CSS, and JS into an AI coding assistant like Claude and ask it to explain how setting stroke-dasharray to the circle's own circumference and then animating stroke-dashoffset produces a proportional filling arc, and why the countdown timer both resets to a fresh window and zeroes the used-request count when it reaches zero rather than just looping the display. The same assistant can help optimize it — ask whether the countdown should sync against a real server-provided reset timestamp instead of a local setInterval to avoid client clock drift. It's also useful for extending the panel: ask it to add a second concentric ring for a longer-period limit, read real X-RateLimit-* response headers instead of the simulated burst, or add a warning toast when usage crosses the critical threshold. Treat the code less like a finished artifact and more like a starting point for a conversation.
Prompt to recreate it
Copy this into your AI assistant of choice to build the effect from scratch, or as a jumping-off point for your own variant:
Build a "rate limit status panel" developer dashboard widget in plain HTML, CSS, and JavaScript with no framework, chart library, or canvas.

Requirements:
- A circular progress ring built from a single SVG circle element using the stroke-dasharray/stroke-dashoffset technique (not a chart library or canvas) to show requests-used as a percentage of a fixed limit, with the remaining request count displayed as text in the center of the ring.
- Next to the ring, show the used/total request counts as text and a live countdown timer (formatted as minutes:seconds) showing time remaining until the rate limit window resets, updating every second via a real interval.
- When the countdown reaches zero, it must wrap around to a fresh full window duration AND reset the used-request count back to zero, mirroring how real fixed-window rate limiters behave — not just loop the timer display disconnected from the usage state.
- The ring's stroke color must shift through at least three tiers (e.g. a calm accent color, amber, red) based on usage percentage, using the same threshold logic that could also color a text label, so they can never disagree.
- A "Simulate request burst" button that adds a randomized cluster of several requests at once to the used count (not one request per click, to mimic how real API traffic arrives in bursts) and logs one representative API endpoint path with a timestamp to a recent-requests list, inserting new entries at the top and capping the list to a handful of visible entries.
- Use a dark, developer-console-style theme with system-ui font for labels and monospace font for endpoint paths, timestamps, and the countdown value.
Want to tighten it up first? Run this prompt through the AI Prompt Studio to score it across 8 quality dimensions, catch anti-patterns, and tune the wording for Claude, ChatGPT, or Gemini before you paste it in.
Step by step
How to Use
- 1Paste HTML, CSS, and JSA rate limit panel renders with a usage ring at 360/1,000 requests and a live countdown.
- 2Watch the countdownIt ticks down every second and wraps to a fresh window when it reaches zero, resetting usage.
- 3Click Simulate request burstA randomized cluster of requests adds to the used count and the ring fills accordingly.
- 4Watch the ring color shiftPast 75% usage the ring turns amber; past 95% it turns red.
- 5Check the recent requests logEach simulated burst logs one representative endpoint call with a timestamp.
- 6Wire up real dataRead actual rate-limit headers from your API responses to drive used and resetSeconds.
Real-world uses
Common Use Cases
Got questions?
Frequently Asked Questions
The ring circle has a fixed stroke-dasharray equal to its own circumference, which splits its stroke into one dash covering the whole circle and one gap of zero length. Animating stroke-dashoffset shifts where that dash starts, visually revealing an arc proportional to whatever percentage you set — a well-known CSS/SVG technique that needs no dependencies.
Real API rate limiters work on fixed or rolling windows — once the window closes, your quota genuinely refills. Making the countdown wrap and zero the used count when it reaches zero demonstrates that real behavior, rather than just running a countdown for decoration disconnected from the usage ring.
Real API usage rarely arrives one call at a time — it comes in clusters from batch jobs, retries, or background syncs. Adding a randomized cluster per click gives a more realistic sense of how quickly a rate limit can be consumed than a steady one-by-one increment would.
Most REST APIs return headers like X-RateLimit-Remaining, X-RateLimit-Limit, and X-RateLimit-Reset (a Unix timestamp) with every response. Read those headers after each real request, compute used as limit minus remaining, compute resetSeconds as the reset timestamp minus the current time, and call render() to update the ring and countdown.
Track used and resetSeconds as component state, derive the tier and ring offset with a computed value, and drive the countdown with a setInterval inside a mount effect (cleaned up on unmount). Update the state directly from your API client's response headers instead of the simulated burst handler.