You Might Also Like
Learn Coding Visually
Learn to code with interactive, live-preview playgrounds — HTML, CSS, JavaScript, React & more.
 HTML Playground42 lessons · Click-based · Live preview
 CSS PlaygroundLearn CSS with a live editor
 JavaScript Playground60 lessons · DOM · Async · Canvas
 React PlaygroundLearn React with a live code editor
 GSAP PlaygroundLearn GSAP animation interactively
 SVG Playground44 lessons · shapes · paths · animation
 SCSS Playground45 lessons · Sass modules · tokens
 Tailwind PlaygroundLearn Tailwind CSS with a live editor
 Bootstrap 5 Playground50 lessons · live preview
AI Function Call Trace — Free Agent Tool-Call Timeline Snippet
AI Function Call Trace · Dashboards · Plain HTML, CSS & JS · Live preview
What's included
Features
About this UI Snippet
AI Function Call Trace — Collapsible Timeline with Status Icons and Expandable JSON
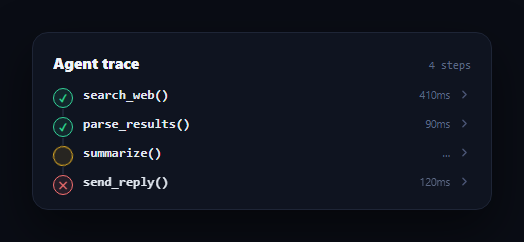
Agentic AI products chain together tool calls — search, parse, summarize, reply — and when something goes wrong, developers and power users need to see exactly what the agent did, in what order, and what each step returned. This snippet builds a collapsible function-call trace in plain HTML, CSS, and vanilla JavaScript: a vertical timeline with status dots, durations, and expandable JSON detail per step.
A connected timeline, not a flat list
Each step in STEPS renders as a .fct-step with a status dot positioned on a vertical connector line that runs down to the next step, using a pseudo-element border rather than a separate SVG or divider element. This makes the sequence read as one continuous execution path — the same visual grammar used in CI/CD pipeline views and this library's AI agent steps — rather than an ambiguous stack of cards.
Status-driven dot styling
The dot's border color, fill, icon, and even an animation are all keyed off one status field per step: green with a checkmark for success, red with an X for error, and amber with a spin animation for pending. Because everything derives from one field, a step can never show a green dot with error text or any other inconsistent combination.
Click to expand, not a separate modal
Each row is collapsible in place using a max-height transition on the detail panel rather than display toggling, so the expand/collapse animates smoothly instead of snapping open. The detail panel shows the step's raw args and result in a monospace, JSON-styled block — exactly what a developer debugging an agent needs without leaving the trace view.
Where this fits in an AI product
Use it in an agent-debugging dashboard next to an AI safety refusal card for the cases where a step legitimately fails or is declined, or pair it with a webhook event tester when the trace involves external API calls. It's also a natural companion to an AI context window indicator, since every tool call in a trace consumes context.
Customizing it
Feed STEPS from a real agent run's execution log, add a retry button on error steps, or add nested sub-steps for tool calls that themselves invoke other tools.
Build with AI
Build, Understand, Optimize, and Extend It With AI
You don't have to work out the connector-line and expand-transition mechanics by hand. Paste this snippet's HTML, CSS, and JS into an AI coding assistant like Claude and ask it to explain how the per-step pseudo-element border creates a continuous-looking timeline without one long absolutely-positioned line spanning the whole list, and why max-height rather than display is used to animate the detail panel open and closed. The same assistant can help optimize it — ask whether a very long trace (dozens of tool calls) should virtualize the list or collapse older steps by default. It's also useful for extending the component: ask it to add nested sub-steps for tools that call other tools, stream new steps in live via a websocket as an agent runs, or add a retry action scoped to failed steps only. Treat the code less like a finished artifact and more like a starting point for a conversation.
Prompt to recreate it
Copy this into your AI assistant of choice to build the effect from scratch, or as a jumping-off point for your own variant:
Build an "AI function call trace" as a collapsible vertical timeline in plain HTML, CSS, and JavaScript with no framework or library.

Requirements:
- Render a sequence of AI agent tool-call steps (e.g. search_web, parse_results, summarize, send_reply) from a single JavaScript data array of objects, each with a function name, a status (success, error, or pending), a duration string, and JSON-like args and result strings — no hand-written per-step markup.
- Each step shows a small status dot connected to the next step's dot by a continuous-looking vertical line, using CSS pseudo-elements or borders rather than a separate absolutely-positioned line spanning the entire list, so the connector still works correctly if steps are added or removed.
- The status dot's border color, fill color, and icon (checkmark, X, or a spinning indicator) must all be derived from that single status field, never set independently, so a step can never visually contradict its own status.
- Each step's row must be clickable to expand/collapse an inline detail panel showing its args and result in a monospace font, animated with a max-height transition (not an abrupt show/hide), and a chevron icon that rotates to indicate open/closed state.
- Show each step's duration text next to its name, and a pending step should not have a fixed duration (e.g. show an ellipsis or "in progress" instead).
- Use a dark theme with system-ui font for labels, monospace font for function names and JSON detail, and distinct colors for success (green), error (red), and pending (amber) states.
Want to tighten it up first? Run this prompt through the AI Prompt Studio to score it across 8 quality dimensions, catch anti-patterns, and tune the wording for Claude, ChatGPT, or Gemini before you paste it in.
Step by step
How to Use
- 1Paste HTML, CSS, and JSA four-step agent trace renders with success, pending, and error states visible.
- 2Click any step rowThe row expands in place to reveal its raw args and result as monospace JSON.
- 3Read the status dotsGreen checkmarks are successes, red X's are errors, and an amber spinner marks a pending step.
- 4Follow the connector lineA vertical line links each dot to the next, showing execution order at a glance.
- 5Edit the STEPS arrayAdd, remove, or reorder tool calls — the timeline regenerates from data.
- 6Wire up a real traceFeed STEPS from your agent framework's execution log or callback events.
Real-world uses
Common Use Cases
Got questions?
Frequently Asked Questions
Each step except the last gets a ::before pseudo-element positioned absolutely as a thin vertical bar running from just below its dot to the top of the next step. Because it is anchored to each step rather than being one long separate line, the timeline still works correctly if steps are added, removed, or have varying expanded heights.
Everything about a step's status presentation — the dot's border and fill color, its icon, and whether it spins — is driven by one status string per step object and a single CSS class applied to the whole .fct-step element. There is no separate place where a color could be set independently and drift out of sync.
Add a button inside the detail panel, conditionally rendered only for steps where status === "error", and wire its click handler to re-invoke that specific tool call in your agent framework, then update that step's status and re-render.
Yes — add a children array to a step object, and recursively render a nested .fct-list (indented) inside that step's detail panel when children is present. The same status/dot/connector logic applies at each nesting level.
Pass the steps array as a prop, track which step indices are expanded in local state (a Set of open indices works well), and render each step's detail panel conditionally or with a CSS max-height bound to that state. The status-to-style mapping becomes a small lookup object or computed class.