

Learn Coding Visually
Learn to code with interactive, live-preview playgrounds — HTML, CSS, JavaScript, React & more.
 HTML Playground42 lessons · Click-based · Live preview
 CSS PlaygroundLearn CSS with a live editor
 JavaScript Playground60 lessons · DOM · Async · Canvas
 React PlaygroundLearn React with a live code editor
 GSAP PlaygroundLearn GSAP animation interactively
 SVG Playground44 lessons · shapes · paths · animation
 SCSS Playground45 lessons · Sass modules · tokens
 Tailwind PlaygroundLearn Tailwind CSS with a live editor
 Bootstrap 5 Playground50 lessons · live preview
AI Agent Steps Timeline — HTML CSS JS Snippet
AI Agent Steps Timeline · Dashboards · Plain HTML, CSS & JS · Live preview
What's included
Features
About this UI Snippet
AI Agent Steps Timeline — Tool-Call Trace, Running/Done States, Expandable Payloads & Elapsed Clock
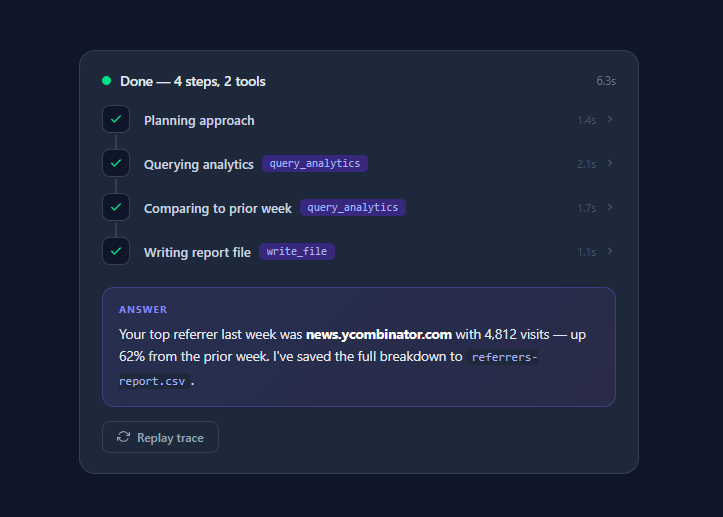
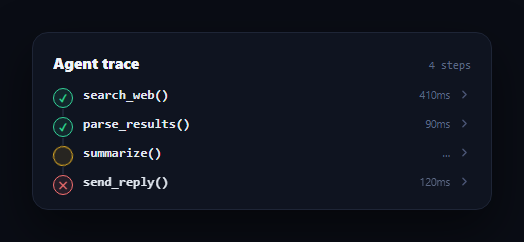
Agentic AI products — coding assistants, research agents, workflow copilots — do not answer in one shot. They plan, call tools, read results, and iterate, often for tens of seconds. Users tolerate that wait only if they can *see* the work happening: which tool is running, what it was asked, what came back. That transparency layer is the agent trace UI, and every serious agent product (Claude Code, ChatGPT agent mode, Perplexity Pro search, Devin) has converged on the same pattern this snippet implements: a vertical timeline of steps with live running states, tool-name badges, expandable input/result payloads, per-step durations, and a final highlighted answer card.
The timeline structure: connector lines without an extra element
Each step is a flex row: a 28px icon tile on the left and the step content on the right. The vertical connector between steps is not a separate element — it is a ::before pseudo-element on each .step, absolutely positioned at left: 13px (the horizontal centre of the icon tile) running from top: 30px (just below the icon) to bottom: -4px (into the next step's padding). The last step suppresses its line with :last-child::before { display: none }. Because the line belongs to the step itself, steps can be appended dynamically and the rail grows automatically — no total-height calculation, no SVG.
Step lifecycle: running → done, driven by scheduled timeouts
The trace is modelled as an array of step objects — icon, display name, tool name, duration, input payload, result payload. The run() function walks this array accumulating an offset: at each step's start time it appends the DOM node with a .running class (indigo border, spinning arc icon via a rotate(360deg) keyframe), and at start-plus-duration it swaps to .done (green check icon, duration stamp). In a real product these two moments correspond exactly to the tool_use and tool_result events your agent loop emits — the demo's setTimeout calls are placeholders for event-stream handlers, which is why the component structure transfers directly to production.
Expandable payloads with the CSS grid-rows trick
Clicking a step row toggles its detail panel — the tool's input JSON and result. The expand/collapse animation uses the modern grid-template-rows: 0fr → 1fr technique: the detail wrapper is a single-track grid whose row animates between zero and full content height, with an inner overflow: hidden element doing the clipping. Unlike the old max-height hack, this animates to the *true* content height regardless of payload size, so short and long JSON blobs both animate smoothly. The chevron rotates 90° in sync via a transform transition. Input payloads render in slate mono text; results render in green (.detail-box.result pre), the universal trace-viewer convention for distinguishing what went in from what came out.
Status header, elapsed clock, and the answer reveal
The header carries a pulsing indigo dot (scale + opacity keyframes) and a live status line that mirrors the current step's name — the equivalent of the "thinking…" ticker in commercial agents. A 100ms setInterval updates the elapsed readout from performance.now() deltas, formatted with font-variant-numeric: tabular-nums so digits don't jitter. When the final step completes, the dot turns green and stops pulsing, the status summarises the run ("Done — 4 steps, 2 tools"), and the answer card — a gradient-tinted, indigo-bordered panel — fades and lifts in with an opacity/translateY transition. Separating *trace* from *answer* visually matters: the trace is evidence, the answer is the deliverable, and users need to find the latter instantly on return visits.
Every timer handle is collected into an array and cleared at the top of run(), so the Replay button can restart the trace mid-flight without orphaned timeouts corrupting the new run — the same discipline you need when a user cancels a real agent run and starts another.
Build with AI
Build, Understand, Optimize, and Extend It With AI
The gap between this demo and a production agent trace is one integration layer, and an AI assistant can bridge it for you. Paste the snippet into Claude and ask it to replace the setTimeout scheduler with handlers for a real Anthropic streaming response — it will show you exactly where content_block_start maps to buildStep() and where your tool execution result fills the green pre. Ask it to add the states the demo omits: an error variant with retry counts, payload truncation with "show more", auto-scroll that follows the newest step, and a post-run collapse toggle summarising the trace. If you're debugging your own agent, do the reverse — ask the assistant to write a function that serialises your agent framework's run log (LangChain callbacks, Vercel AI SDK steps, or raw API events) into this snippet's TRACE shape so you get an instant replay viewer for any historical run. The timeline CSS, grid-rows expander, and timer bookkeeping are the parts worth interrogating line by line; ask why each exists and what breaks without it.
Prompt to recreate it
Copy this into your AI assistant of choice to build the effect from scratch, or as a jumping-off point for your own variant:
Build an AI agent tool-call trace timeline in plain HTML, CSS, and JavaScript that replays a multi-step agent run with live states — no frameworks.

Requirements:
- Model the run as an array of step objects: a human-readable name, an optional tool name shown as a monospace badge pill, a duration in milliseconds, an optional pretty-printed JSON input payload, and a result payload.
- Render steps as a vertical timeline where each step has an icon tile and the connector line between steps is a ::before pseudo-element on the step itself, so the rail grows automatically as steps are appended and the last step suppresses its segment.
- Schedule the replay so each step first appears in a "running" state (accent border, continuously spinning arc icon via CSS keyframes, and the header status text mirroring the step name), then flips to "done" (green check icon, duration stamped in tabular figures) after its duration elapses.
- Make each step row clickable to expand a detail panel showing the Input and Result payloads in labelled boxes — results tinted green, inputs neutral — using the grid-template-rows 0fr to 1fr technique with an inner overflow-hidden wrapper so panels animate to their true content height, with a chevron that rotates in sync.
- Show a header with a pulsing status dot and a live elapsed-seconds clock driven by performance.now() on a 100ms interval; when the final step completes, stop and green the dot, summarise the run ("Done — N steps, M tools"), and fade-and-lift in a visually distinct gradient-bordered answer card separate from the trace.
- Include a replay button, and collect every timeout and interval handle into an array that gets cleared at the start of each run so replaying mid-flight never leaves orphaned timers.
- Comment the code to mark exactly which two moments correspond to real tool_use and tool_result events from a streaming LLM API, so the scheduler can be swapped for live event handlers.
Want to tighten it up first? Run this prompt through the AI Prompt Studio to score it across 8 quality dimensions, catch anti-patterns, and tune the wording for Claude, ChatGPT, or Gemini before you paste it in.
Source Code
<div class="agent-card">
  <div class="agent-head">
    <div class="agent-title">
      <span class="agent-dot" id="agent-dot"></span>
      <span id="agent-status">Agent working…</span>
    </div>
    <span class="agent-elapsed" id="agent-elapsed">0.0s</span>
  </div>

  <div class="steps" id="steps"></div>

  <div class="agent-answer" id="agent-answer">
    <div class="answer-label">Answer</div>
    <p>Your top referrer last week was <strong>news.ycombinator.com</strong> with 4,812 visits — up 62% from the prior week. I've saved the full breakdown to <code>referrers-report.csv</code>.</p>
  </div>

  <button class="replay-btn" id="btn-replay">
    <svg width="13" height="13" viewBox="0 0 24 24" fill="none" stroke="currentColor" stroke-width="2"><path d="M23 4v6h-6M1 20v-6h6"/><path d="M3.5 9a9 9 0 0 1 14.9-3.4L23 10M1 14l4.6 4.4A9 9 0 0 0 20.5 15"/></svg>
    Replay trace
  </button>
</div>
* { box-sizing: border-box; margin: 0; padding: 0; }
body { font-family: system-ui, sans-serif; background: #0f172a; min-height: 100vh; display: flex; align-items: center; justify-content: center; padding: 24px; }
.agent-card {
width: 100%; max-width: 560px;
background: #1e293b; border: 1px solid #334155;
border-radius: 16px; padding: 20px 22px;
}
/* — Header — */
.agent-head { display: flex; align-items: center; justify-content: space-between; margin-bottom: 16px; }
.agent-title { display: flex; align-items: center; gap: 9px; font-size: 13.5px; font-weight: 600; color: #e2e8f0; }
.agent-dot {
width: 9px; height: 9px; border-radius: 50%;
background: #818cf8;
animation: pulse-dot 1.2s ease-in-out infinite;
}
.agent-dot.done { background: #4ade80; animation: none; }
@keyframes pulse-dot { 0%,100% { transform: scale(1); opacity: 1; } 50% { transform: scale(1.5); opacity: 0.5; } }
.agent-elapsed { font-size: 11.5px; color: #64748b; font-variant-numeric: tabular-nums; }
/* — Timeline — */
.steps { display: flex; flex-direction: column; position: relative; }
.step { display: flex; gap: 14px; position: relative; padding-bottom: 4px; }
/* connector line */
.step::before {
content: ''; position: absolute;
left: 13px; top: 30px; bottom: -4px;
width: 2px; background: #334155;
}
.step:last-child::before { display: none; }
.step-icon {
width: 28px; height: 28px; border-radius: 8px; flex-shrink: 0;
display: flex; align-items: center; justify-content: center;
background: #0f172a; border: 1px solid #334155; color: #64748b;
position: relative; z-index: 1;
transition: all 0.25s;
}
.step.running .step-icon { border-color: #6366f1; color: #a5b4fc; }
.step.done .step-icon { border-color: #334155; color: #4ade80; }
.step.running .step-icon svg { animation: spin 1.1s linear infinite; }
@keyframes spin { to { transform: rotate(360deg); } }
.step-main { flex: 1; min-width: 0; padding-bottom: 12px; }
.step-row {
display: flex; align-items: center; gap: 8px;
min-height: 28px; cursor: pointer; user-select: none;
}
.step-name { font-size: 13px; font-weight: 600; color: #cbd5e1; }
.step-tool {
font-size: 11px; font-family: 'SF Mono', Consolas, monospace;
color: #a5b4fc; background: #312e81;
padding: 2px 8px; border-radius: 5px;
}
.step-time { font-size: 11px; color: #475569; margin-left: auto; font-variant-numeric: tabular-nums; }
.step-chevron { color: #475569; transition: transform 0.2s; display: flex; }
.step.expanded .step-chevron { transform: rotate(90deg); }
/* Expandable detail */
.step-detail {
display: grid; grid-template-rows: 0fr;
transition: grid-template-rows 0.28s ease;
}
.step.expanded .step-detail { grid-template-rows: 1fr; }
.step-detail-inner { overflow: hidden; }
.detail-box {
margin-top: 8px; background: #0f172a;
border: 1px solid #1e293b; border-radius: 9px;
padding: 10px 12px;
}
.detail-label {
font-size: 10px; font-weight: 700; letter-spacing: 0.08em;
text-transform: uppercase; color: #475569; margin-bottom: 5px;
}
.detail-box pre {
font-family: 'SF Mono', Consolas, monospace; font-size: 11.5px;
color: #94a3b8; line-height: 1.6;
white-space: pre-wrap; word-break: break-word;
}
.detail-box + .detail-box { margin-top: 8px; }
.detail-box.result pre { color: #86efac; }
/* — Answer — */
.agent-answer {
margin-top: 6px; padding: 14px 16px;
background: linear-gradient(135deg, rgba(99,102,241,0.12), rgba(168,85,247,0.08));
border: 1px solid rgba(99,102,241,0.35);
border-radius: 12px;
opacity: 0; transform: translateY(6px);
transition: opacity 0.4s, transform 0.4s;
}
.agent-answer.visible { opacity: 1; transform: none; }
.answer-label {
font-size: 10px; font-weight: 700; letter-spacing: 0.1em;
text-transform: uppercase; color: #818cf8; margin-bottom: 6px;
}
.agent-answer p { font-size: 13.5px; color: #e2e8f0; line-height: 1.65; }
.agent-answer strong { color: #fff; }
.agent-answer code { background: #1e293b; color: #a5b4fc; padding: 1px 6px; border-radius: 5px; font-size: 12px; font-family: 'SF Mono', Consolas, monospace; }
/* — Replay — */
.replay-btn {
margin-top: 14px; display: flex; align-items: center; gap: 7px;
background: none; border: 1px solid #334155; color: #94a3b8;
padding: 7px 14px; border-radius: 8px;
font-size: 12px; font-weight: 600; font-family: inherit;
cursor: pointer; transition: all 0.15s;
}
.replay-btn:hover { border-color: #6366f1; color: #e2e8f0; }const ICONS = {
think: '<svg width="14" height="14" viewBox="0 0 24 24" fill="none" stroke="currentColor" stroke-width="2"><path d="M12 2a7 7 0 0 1 7 7c0 2.4-1.2 4.1-2.6 5.4-.8.8-1.4 1.9-1.4 3.1V18h-6v-.5c0-1.2-.6-2.3-1.4-3.1C6.2 13.1 5 11.4 5 9a7 7 0 0 1 7-7z"/><path d="M9 21h6"/></svg>',
tool: '<svg width="14" height="14" viewBox="0 0 24 24" fill="none" stroke="currentColor" stroke-width="2"><path d="M14.7 6.3a1 1 0 0 0 0 1.4l1.6 1.6a1 1 0 0 0 1.4 0l3.77-3.77a6 6 0 0 1-7.94 7.94l-6.91 6.91a2.12 2.12 0 0 1-3-3l6.91-6.91a6 6 0 0 1 7.94-7.94l-3.76 3.76z"/></svg>',
search: '<svg width="14" height="14" viewBox="0 0 24 24" fill="none" stroke="currentColor" stroke-width="2"><circle cx="11" cy="11" r="8"/><path d="M21 21l-4.35-4.35"/></svg>',
file: '<svg width="14" height="14" viewBox="0 0 24 24" fill="none" stroke="currentColor" stroke-width="2"><path d="M14 2H6a2 2 0 0 0-2 2v16a2 2 0 0 0 2 2h12a2 2 0 0 0 2-2V8z"/><path d="M14 2v6h6"/></svg>',
check: '<svg width="14" height="14" viewBox="0 0 24 24" fill="none" stroke="currentColor" stroke-width="2.5"><path d="M20 6L9 17l-5-5"/></svg>',
spin: '<svg width="14" height="14" viewBox="0 0 24 24" fill="none" stroke="currentColor" stroke-width="2"><path d="M21 12a9 9 0 1 1-6.2-8.56"/></svg>',
};
// The trace: each entry is one agent step with tool name, args and result.
const TRACE = [
{ icon: 'think', name: 'Planning approach', tool: null, dur: 1400,
input: null,
result: 'Need analytics data for last week grouped by referrer, then compare to prior week, then export.' },
{ icon: 'search', name: 'Querying analytics', tool: 'query_analytics', dur: 2100,
input: '{ "metric": "visits",\n "group_by": "referrer",\n "range": "last_7_days" }',
result: '[{ "referrer": "news.ycombinator.com", "visits": 4812 },\n { "referrer": "google.com", "visits": 3204 },\n { "referrer": "twitter.com", "visits": 1877 }]' },
{ icon: 'search', name: 'Comparing to prior week', tool: 'query_analytics', dur: 1700,
input: '{ "metric": "visits",\n "group_by": "referrer",\n "range": "prior_7_days" }',
result: '[{ "referrer": "news.ycombinator.com", "visits": 2970 }, ...] // +62%' },
{ icon: 'file', name: 'Writing report file', tool: 'write_file', dur: 1100,
input: '{ "path": "referrers-report.csv",\n "rows": 14 }',
result: 'Wrote 14 rows (1.2 KB) to referrers-report.csv' },
];
const stepsEl = document.getElementById('steps');
const statusEl = document.getElementById('agent-status');
const dotEl = document.getElementById('agent-dot');
const answerEl = document.getElementById('agent-answer');
const elapsedEl = document.getElementById('agent-elapsed');
let timers = [];
function buildStep(t) {
const el = document.createElement('div');
el.className = 'step';
el.innerHTML =
'<div class="step-icon">' + ICONS.spin + '</div>' +
'<div class="step-main">' +
'<div class="step-row">' +
'<span class="step-name">' + t.name + '</span>' +
(t.tool ? '<span class="step-tool">' + t.tool + '</span>' : '') +
'<span class="step-time"></span>' +
'<span class="step-chevron"><svg width="12" height="12" viewBox="0 0 24 24" fill="none" stroke="currentColor" stroke-width="2.5"><path d="M9 18l6-6-6-6"/></svg></span>' +
'</div>' +
'<div class="step-detail"><div class="step-detail-inner">' +
(t.input ? '<div class="detail-box"><div class="detail-label">Input</div><pre>' + t.input + '</pre></div>' : '') +
'<div class="detail-box result"><div class="detail-label">Result</div><pre>' + t.result + '</pre></div>' +
'</div></div>' +
'</div>';
el.querySelector('.step-row').addEventListener('click', () => el.classList.toggle('expanded'));
return el;
}
function run() {
timers.forEach(clearTimeout);
timers = [];
stepsEl.innerHTML = '';
answerEl.classList.remove('visible');
dotEl.classList.remove('done');
statusEl.textContent = 'Agent working…';
const t0 = performance.now();
const clock = setInterval(() => {
elapsedEl.textContent = ((performance.now() - t0) / 1000).toFixed(1) + 's';
}, 100);
timers.push(clock);
let at = 0;
TRACE.forEach((t, i) => {
// start step
timers.push(setTimeout(() => {
const el = buildStep(t);
el.classList.add('running');
stepsEl.appendChild(el);
statusEl.textContent = t.name + '…';
}, at));
at += t.dur;
// finish step
timers.push(setTimeout(() => {
const el = stepsEl.children[i];
el.classList.remove('running');
el.classList.add('done');
el.querySelector('.step-icon').innerHTML = ICONS.check;
el.querySelector('.step-time').textContent = (t.dur / 1000).toFixed(1) + 's';
if (i === TRACE.length - 1) {
clearInterval(clock);
dotEl.classList.add('done');
statusEl.textContent = 'Done — 4 steps, 2 tools';
answerEl.classList.add('visible');
}
}, at));
});
}
document.getElementById('btn-replay').addEventListener('click', run);
run();Step by step
How to Use
- 1Watch the trace and inspect the payloadsThe agent runs automatically: each step appears with a spinning icon and indigo border while "running", then flips to a green check with its duration stamped. Click any step row to expand its Input and Result payloads — the chevron rotates and the panel animates open to its natural height. When the last step finishes, the header dot turns green and the answer card fades in. Click "Replay trace" to run it again.
- 2Drive it from real agent eventsReplace the setTimeout scheduling in run() with your event stream. On a tool_use event: stepsEl.appendChild(buildStep({ icon: "tool", name: ev.label, tool: ev.name, input: JSON.stringify(ev.input, null, 2) })) and add the .running class. On the matching tool_result event: swap .running for .done, inject the check icon, fill .step-time, and set the result pre. The Anthropic and OpenAI streaming APIs both emit exactly these paired events.
- 3Edit the demo traceThe TRACE array defines each step: icon (think/search/tool/file — keys into the ICONS map), name (the human label), tool (the monospace badge, or null for reasoning steps), dur (milliseconds), input (pretty-printed JSON string, or null), and result. Add steps or swap the scenario — a coding agent might use read_file, run_tests, edit_file; a research agent web_search, fetch_page, summarise.
- 4Add error and retry statesReal tools fail. Add a .step.error variant: red border on the icon tile (#f87171), an X icon, and a result box styled with color: #fca5a5. If your agent retries, append a second step with the same tool badge rather than mutating the failed one — traces should be append-only so users can audit what actually happened. A "3 retries" count in .step-time communicates flakiness honestly.
- 5Collapse the trace behind a summary toggleLong agent runs produce 20+ steps. Wrap .steps in the same grid-template-rows: 0fr/1fr container used for step details, collapsed by default once the run completes, with a toggle row reading "Ran 23 steps in 41s". Users who trust the agent see only the answer; users who want the evidence expand the trace. This is the pattern Perplexity and ChatGPT both settled on.
- 6Export and compose with chatClick JSX for React. Render steps from an array in state, keyed by a stable step id, and let CSS handle the running/done transitions — do not animate with JS in React. This component slots between a user message and the streamed answer: pair it with the AI Streaming Response for the answer body, the AI Thinking Loader for pre-planning wait, and the AI Chat Interface shell.
Real-world uses
Common Use Cases
Got questions?
Frequently Asked Questions
Both APIs emit paired events you map directly onto this UI. With the Anthropic API, a streamed response containing tool use gives you a content_block_start with type tool_use (append a running step: the block's name fills the tool badge, and accumulate input_json deltas into the Input pre), and after you execute the tool and continue the conversation, render your tool_result as the step's Result and mark it done. With OpenAI, the equivalent is the function-call deltas followed by your function response. The key structural decision this snippet already makes for you: buildStep() renders one step from a plain object, so your event handlers just construct that object incrementally — no timeline-wide re-render needed.
The classic max-height transition requires guessing a ceiling (max-height: 500px) — too low clips long payloads, too high makes short panels animate with a visible delay because the transition interpolates through hundreds of unused pixels. Animating grid-template-rows from 0fr to 1fr sidesteps this entirely: the fr unit resolves to the row's actual content height, so a 3-line result and a 40-line result both animate edge-to-edge in exactly 0.28s. The one requirement is an inner wrapper with overflow: hidden (here .step-detail-inner), because the grid track clips at the track level, not the content level. Browser support has been universal since 2023.
Three practices from production agent UIs: collapse by default after completion (wrap the .steps container in the same 0fr/1fr grid trick with a "Ran N steps in Xs" toggle row), auto-scroll during the run (call el.scrollIntoView({ block: "nearest", behavior: "smooth" }) on each newly appended step so the newest work stays visible), and truncate payloads (render the first ~15 lines of a result with a "show all" link, since a 400-line tool output inside an animated panel hurts both performance and readability). If traces exceed ~100 steps, render only the last 30 with a "show earlier steps" button — the DOM cost of hidden expanded panels adds up.
Yes. In Tailwind, the card is bg-slate-800 border border-slate-700 rounded-2xl; icon tiles are size-7 rounded-lg border flex items-center justify-center with data-[state=running]:border-indigo-500 data-[state=done]:text-green-400 variants; the connector line needs a small arbitrary-value utility (before:absolute before:left-[13px] before:top-[30px] before:-bottom-1 before:w-0.5 before:bg-slate-700); and the expander maps to grid grid-rows-[0fr] data-[open]:grid-rows-[1fr] transition-[grid-template-rows]. In Angular, model the trace as a signal array of step objects, render with @for tracked by step id, drive running/done via a class binding, and use the native animation-friendly CSS as-is — no Angular animations module required since all transitions are class-toggled CSS.