You Might Also Like
Learn Coding Visually
Learn to code with interactive, live-preview playgrounds — HTML, CSS, JavaScript, React & more.
 HTML Playground42 lessons · Click-based · Live preview
 CSS PlaygroundLearn CSS with a live editor
 JavaScript Playground60 lessons · DOM · Async · Canvas
 React PlaygroundLearn React with a live code editor
 GSAP PlaygroundLearn GSAP animation interactively
 SVG Playground44 lessons · shapes · paths · animation
 SCSS Playground45 lessons · Sass modules · tokens
 Tailwind PlaygroundLearn Tailwind CSS with a live editor
 Bootstrap 5 Playground50 lessons · live preview
API Response Inspector — Free HTTP Request/Response Panel UI
API Response Inspector · Dashboards · Plain HTML, CSS & JS · Live preview
What's included
Features
About this UI Snippet
API Response Inspector — Tabs, Manual JSON Highlighting & Copy
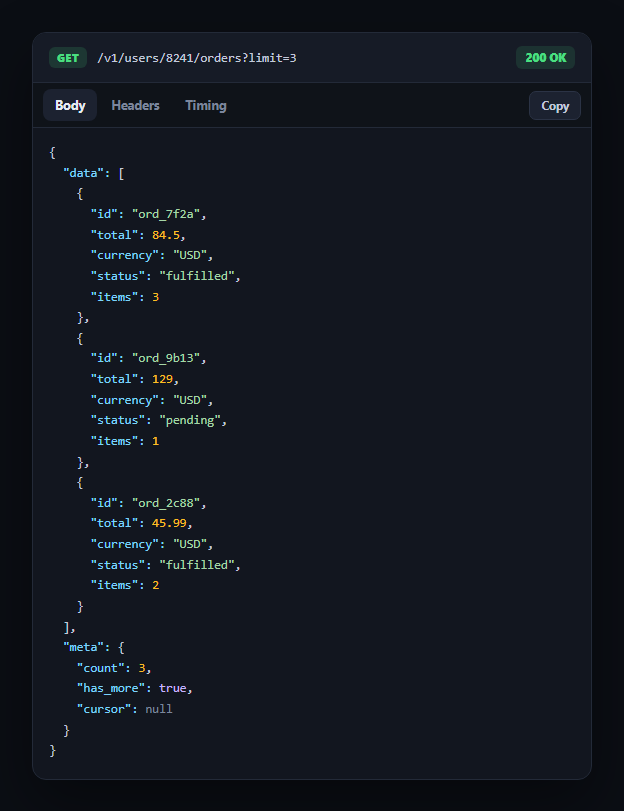
Every developer tool that surfaces an HTTP exchange — an API explorer, a webhook debugger, a support-facing request log — needs the same panel: the request line, a status badge, and tabbed access to the body, headers, and timing. This snippet builds that panel with hand-rolled JSON syntax highlighting and no dependency, pairing well with a code diff viewer or api key manager in a developer dashboard.
Syntax highlighting with one regular expression
Rather than a highlighting library, syntaxHighlight() runs a single regex over the stringified JSON that matches strings, booleans, null, and numbers in one pass, then classifies each match by inspecting it: a quoted string followed by a colon is a key, any other quoted string is a value, and so on. This is the same technique used by classic vanilla JSON highlighters — it's not a full JSON parser, but for displaying already-valid JSON.stringify output it's reliable and tiny.
HTML-escaping before highlighting
The raw JSON string is escaped for &, <, and > before the highlighting regex runs, and the highlighted output is injected via innerHTML. Escaping first matters because response bodies can legitimately contain angle brackets in string values — skipping this step would let response content break the panel's markup.
Tabs driven by a data attribute, not three separate handlers
Each tab button carries data-tab, and a single click handler looks up the matching panel from a panels object keyed by that same string — adding a fourth tab means adding one button and one panel, not another branch of conditional logic. aria-selected is kept in sync with the .active class on every click, so the accessible state matches the visual one.
A copy button that degrades gracefully
The copy handler tries navigator.clipboard.writeText, which is unavailable in some sandboxed/insecure contexts, and falls back to just showing the "Copied" confirmation either way rather than throwing — because from a UI perspective, telling the user copy failed silently is worse than a harmless no-op in an environment where clipboard access is blocked.
A timing breakdown built from CSS bars
Each timing row pairs a label, a proportionally-widthed bar, and a millisecond value — the bar widths are set inline as percentages of total request time, the same lightweight technique used in git diff stat summary's insertion/deletion bars. Swap in real PerformanceResourceTiming values from fetch or XMLHttpRequest to make this reflect an actual request.
Build with AI
Build, Understand, Optimize, and Extend It With AI
You don't have to write a JSON tokenizer from scratch to understand this. Paste this snippet's HTML, CSS, and JS into an AI coding assistant like Claude and ask it to explain exactly how syntaxHighlight()'s single regular expression matches and classifies JSON keys, strings, numbers, booleans, and null in one pass without a full parser, and why the HTML-escaping step has to happen before the highlighting regex runs rather than after. The same assistant can help optimize it — asking whether the regex-based approach could misclassify a string value that happens to contain a colon followed by whitespace, and how a real JSON parser with position tracking would avoid that edge case. It's also useful for extending the panel: ask it to wire the timing tab to the real Resource Timing API for an actual fetch() call, add a request-body tab for POST/PUT requests, or add a raw/pretty toggle for the JSON view. Treat the code less like a finished artifact and more like a starting point for a conversation.
Prompt to recreate it
Copy this into your AI assistant of choice to build the effect from scratch, or as a jumping-off point for your own variant:
Build an "API response inspector" panel in plain HTML, CSS, and JavaScript with no library or CDN dependency.

Requirements:
- A request bar showing an HTTP method badge, the request URL, and a color-coded status badge (green for 2xx, red for error codes).
- A tab bar with at least three tabs (Body, Headers, Timing) where each tab button carries a data-tab attribute and a single shared click handler looks up and shows the matching panel from a JS object keyed by that same attribute value — not one separate click handler or if/else branch per tab.
- The Body tab must show a JSON response manually syntax-highlighted using one regular expression (not a library) that matches and color-classifies object keys, string values, numbers, booleans, and null differently — and the raw JSON string must be HTML-escaped (for &, <, >) before the highlighting regex runs and the result is injected via innerHTML, since response data could otherwise contain characters that break the markup.
- The Headers tab shows a simple key/value list of mock response headers; the Timing tab shows several request phases (DNS, TCP/TLS, waiting, content download) each as a label plus a proportionally-widthed bar (set via inline CSS width percentage) plus a millisecond value, with a total at the bottom.
- A Copy button that copies the raw JSON body to the clipboard using the Clipboard API when available, shows a brief "Copied" confirmation state, and falls back gracefully (no thrown error, still shows the confirmation) in environments where the Clipboard API is unavailable or blocked.
Want to tighten it up first? Run this prompt through the AI Prompt Studio to score it across 8 quality dimensions, catch anti-patterns, and tune the wording for Claude, ChatGPT, or Gemini before you paste it in.
Step by step
How to Use
- 1Paste HTML, CSS, and JSA request/response panel renders on the Body tab with highlighted JSON.
- 2Switch tabsClick Headers or Timing to see the response headers list or a request-phase timing breakdown.
- 3Click CopyThe raw JSON body is copied to the clipboard with a brief "Copied" confirmation.
- 4Swap in real dataReplace the responseData object with an actual fetch() response body.
- 5Add real headers/timingPopulate the headers list from response.headers and the timing bars from PerformanceResourceTiming.
- 6Add more tabsAdd a button with a new data-tab value and a matching entry in the panels object — no other logic changes.
Real-world uses
Common Use Cases
Got questions?
Frequently Asked Questions
A single regular expression matches quoted strings, booleans, null, and numbers across the stringified JSON in one pass. Each match is then classified in a callback: a quoted string immediately followed by a colon is styled as a key, any other quoted string as a string value, and so on for booleans, null, and numbers — each gets a CSS class with its own color.
Response body content can legitimately contain characters like < or > inside string values. Escaping them for &, <, and > before running the highlighting regex and injecting via innerHTML ensures response content is always treated as text, never as markup — protecting the panel from being broken or manipulated by the data it's displaying.
Add a new button with role="tab" and a data-tab value (e.g. data-tab="cookies"), add a matching panel element, and add one entry to the panels object keyed by that same string. The existing click handler already loops generically over all tabs and panel keys, so no new conditional logic is needed.
The copy handler checks for navigator.clipboard.writeText before calling it, and falls back to simply showing the "Copied" confirmation regardless of whether the write succeeded. This avoids throwing an error in sandboxed or insecure (non-HTTPS) contexts where clipboard access is blocked, prioritizing a harmless no-op over a broken button.
Use the Resource Timing API: after a fetch() call, look up performance.getEntriesByName(url)[0] and read its domainLookupStart/End, connectStart/End, responseStart, and responseEnd timestamps to compute each phase's duration. Set each timing bar's inline width as a percentage of the total duration, exactly as the mock values are set here.