You Might Also Like
Learn Coding Visually
Learn to code with interactive, live-preview playgrounds — HTML, CSS, JavaScript, React & more.
 HTML Playground42 lessons · Click-based · Live preview
 CSS PlaygroundLearn CSS with a live editor
 JavaScript Playground60 lessons · DOM · Async · Canvas
 React PlaygroundLearn React with a live code editor
 GSAP PlaygroundLearn GSAP animation interactively
 SVG Playground44 lessons · shapes · paths · animation
 SCSS Playground45 lessons · Sass modules · tokens
 Tailwind PlaygroundLearn Tailwind CSS with a live editor
 Bootstrap 5 Playground50 lessons · live preview
Usage-Based Billing Meter — Free Metered SaaS Usage Widget (HTML/CSS/JS)
Usage-Based Billing Meter · Dashboards · Plain HTML, CSS & JS · Live preview
What's included
Features
About this UI Snippet
Usage-Based Billing Meter — Show the Overage Math, Not Just a Bar
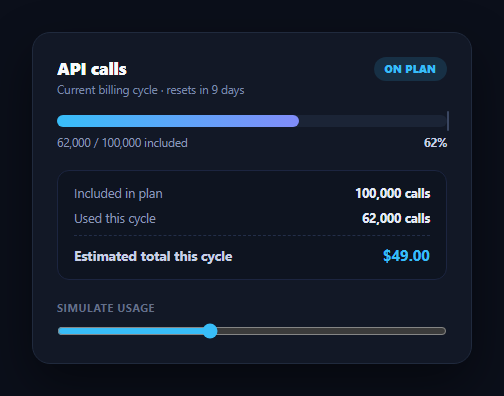
Usage-based SaaS pricing — pay for what you use above an included allowance — is everywhere in API platforms, storage products, and infrastructure tools, but it creates a specific UX problem: a plain progress bar tells a customer they're "at 86%" without telling them what that means in dollars. This snippet builds a metered-usage widget in plain HTML, CSS, and vanilla JavaScript that shows the actual cost math — included allowance, units used, the per-unit overage rate, and a running estimated total — so a customer never gets a billing surprise.
A bar that means something
The track fills toward the included allowance and is visually capped at 100%, with a subtle marker showing exactly where the allowance line sits. Once usage crosses that line, the fill and the status badge shift from blue to orange — a single isOver boolean in render() drives both, so the color story is always consistent with the numbers underneath.
Overage math shown, not hidden
Below the bar, a breakdown lists the included allowance, the units used, and — only once usage exceeds the allowance — an overage line that spells out the exact arithmetic: the number of units over allowance multiplied by the per-unit rate, equalling the overage cost. That overage line is entirely hidden while usage is within the plan, so the widget stays clean for the common case and only surfaces complexity when it's actually relevant.
One render function, one source of truth
Everything — the fill width, the badge, the used/included labels, the overage line, and the estimated total — is computed inside a single render(used) function from three constants: the included allowance, the overage rate, and the base plan price. There's no way for the bar to say one thing and the cost summary to say another, because both come from the same used number on every call. The demo slider exists only to let you see every state; in production you'd call render() with a real usage count from your metering pipeline.
Estimated total, not a guess
The "estimated total this cycle" line is simply base price plus overage cost — real math a finance-conscious customer can verify by hand, which is exactly what builds trust in metered billing. Pair it with a quota usage meter for hard-limit resources, an invoice preview for the eventual bill, or a usage calculator so prospects can estimate cost before they sign up.
Customizing it
Swap the resource (storage GB, compute minutes, seats-with-overage), change the overage rate or add tiered overage pricing (different rates per band), or wire the days-remaining note to a real billing-cycle end date. Because the math lives in one function, extending it to tiered rates is a matter of replacing the single multiplication with a small loop over rate bands.
Build with AI
Build, Understand, Optimize, and Extend It With AI
You don't have to work out the overage math by hand. Paste this snippet's HTML, CSS, and JS into an AI coding assistant like Claude and ask it to trace exactly how a single render(used) call derives the fill width, the on-plan/over-allowance badge state, the conditional overage line, and the estimated total from three constants — the included allowance, the per-unit overage rate, and the base plan price — so you can see why all four pieces of UI can never contradict each other. The same assistant can help you extend it: ask how to add tiered overage pricing with multiple rate bands instead of one flat rate, how to animate the transition when the bar crosses the allowance marker, or how to wire the days-remaining note to a real billing-cycle end date rather than a hardcoded number. Treat the code less like a finished artifact and more like a starting point for a conversation.
Prompt to recreate it
Copy this into your AI assistant of choice to build the effect from scratch, or as a jumping-off point for your own variant:
Build a "usage-based billing meter" widget in plain HTML, CSS, and JavaScript with no framework or library.

Requirements:
- Track one metered resource (e.g. API calls) with three constants: an included monthly allowance, a base plan price, and a per-unit overage rate charged only above that allowance.
- Render a horizontal progress bar whose fill is visually capped at 100% of the included allowance, with a small marker showing exactly where that allowance boundary sits.
- Below the bar, show a breakdown with the included allowance, the units used this cycle, and — only when usage exceeds the allowance — an overage line spelling out the exact arithmetic (overage units × rate = overage cost).
- Compute an "estimated total this cycle" as base price plus overage cost, and make sure it updates live.
- Drive the bar color and a status badge (e.g. "On plan" vs "Over allowance") from the same over-allowance boolean so they never disagree with the cost breakdown.
- Add a demo range input that simulates usage from 0 up through well past the allowance, calling one render(used) function on input so every part of the widget — bar, badge, breakdown, and total — recomputes from that single number.
- Format large numbers with thousands separators and money values to two decimal places.
Want to tighten it up first? Run this prompt through the AI Prompt Studio to score it across 8 quality dimensions, catch anti-patterns, and tune the wording for Claude, ChatGPT, or Gemini before you paste it in.
Step by step
How to Use
- 1Paste HTML, CSS, and JSAn "API calls" usage card renders mid-cycle with the bar under the allowance.
- 2Drag the demo sliderSimulated usage moves from 0 up to 160,000 calls.
- 3Watch it cross 100%Past the included allowance the bar and badge turn orange.
- 4Read the overage lineIt appears only once over allowance, showing qty × rate = cost.
- 5Check the estimated totalBase price plus overage cost updates live at the bottom.
- 6Wire up real dataReplace the slider with a call to render(realUsageCount) from your metering API.
Real-world uses
Common Use Cases
Got questions?
Frequently Asked Questions
Overage quantity is usage minus the included allowance (only when usage exceeds it), and overage cost is that quantity multiplied by a fixed per-unit rate. The estimated total is the base plan price plus overage cost. All three values are computed inside render() from the same used number, so the bar, the badge, and the cost math can never disagree.
Showing overage math for a customer who is comfortably within their plan adds noise without adding information. The line is toggled via the isOver boolean and only renders once usage actually exceeds the included allowance, keeping the widget clean for the common case.
Replace the single overageQty * RATE multiplication with a small loop over an array of rate bands (e.g. the next 50,000 units at one rate, everything beyond at a lower rate), summing each band's contribution. The rest of the widget — the bar, badge, and total — doesn't need to change since it just reads the resulting overageCost.
Yes — wrap the markup and render() call in a loop over an array of resource configs (each with its own included allowance, rate, and used value), similar to how a quota usage meter renders multiple rows from one dataset.
Keep INCLUDED, RATE, and BASE_PRICE as props or constants, and derive pct, isOver, overageQty, overageCost, and total with useMemo (React) or a computed property (Vue) from the used value. The CSS classes for the over-allowance state port unchanged.