

Learn Coding Visually
Learn to code with interactive, live-preview playgrounds — HTML, CSS, JavaScript, React & more.
 HTML Playground42 lessons · Click-based · Live preview
 CSS PlaygroundLearn CSS with a live editor
 JavaScript Playground60 lessons · DOM · Async · Canvas
 React PlaygroundLearn React with a live code editor
 GSAP PlaygroundLearn GSAP animation interactively
 SVG Playground44 lessons · shapes · paths · animation
 SCSS Playground45 lessons · Sass modules · tokens
 Tailwind PlaygroundLearn Tailwind CSS with a live editor
 Bootstrap 5 Playground50 lessons · live preview
Usage Pricing Calculator — Free HTML CSS JS Snippet
Usage Pricing Calculator · Pricing · Plain HTML, CSS & JS · Live preview
What's included
Features
About this UI Snippet
Usage Pricing Calculator — Interactive Sliders, Non-Linear Scale & Live Cost Breakdown
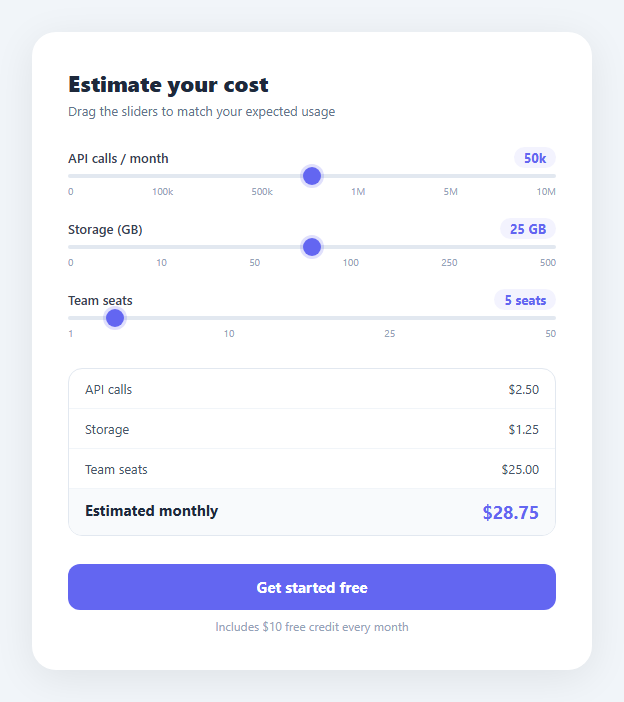
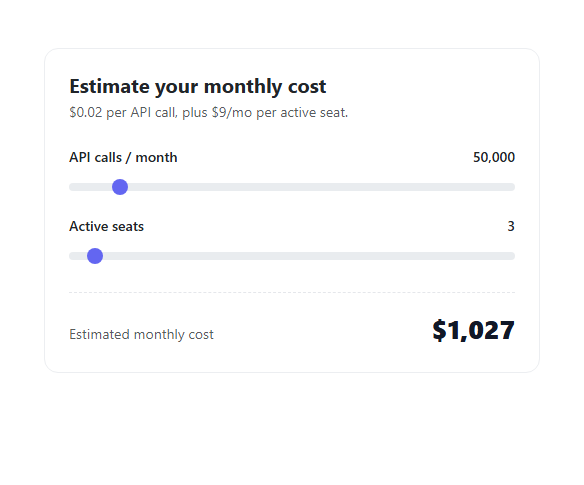
If you need a pricing calculator that lets users estimate their bill before signing up, this snippet gives you a complete interactive cost estimator with three sliders, a live per-line cost breakdown, and a call-to-action — all in plain HTML, CSS, and vanilla JavaScript.
Why usage-based pricing needs an interactive calculator
Flat-rate pricing is easy to read. Usage-based pricing is not. When you charge per API call, per gigabyte, and per seat, a static pricing table cannot give users a personalised estimate. An interactive slider calculator solves this: the user sets their expected usage, the page shows their exact monthly cost, and price anxiety disappears before they click the CTA.
How the non-linear slider values work
The API calls slider covers a huge range — from 0 to 5 million calls per month. A standard linear range input cannot handle this: dragging 1mm would jump from 0 to 500k calls. Instead, the apiTiers array holds real-world usage tiers: [0, 1000, 5000, 10000, 25000, 50000, 100000, 250000, 500000, 1000000, 5000000]. The slider value (0–10) is used as a direct array index. Each step covers a meaningful usage tier rather than a linear percentage. The storageTicks array uses the same technique for storage: [0, 1, 2, 5, 10, 25, 50, 100, 250, 500] GB, mapped from a 0–10 slider via index rounding.
How the live cost calculation works
On every oninput event, calc() reads all three slider values, looks up the API and storage amounts from the lookup arrays, applies the flat rates (apiRate = $0.05 per 1000 calls, storage = $0.05/GB, seatRate = $5/seat), and updates all displayed values simultaneously: the value chip above each slider, each per-line cost in the breakdown, and the grand total. The fmt() function formats large numbers as k/M suffixes. fmtPrice() always shows two decimal places.
Custom styled range inputs
The default browser range input looks inconsistent across browsers. This snippet styles the track as a 4px rounded bar in a neutral grey, and the thumb as an 18px indigo circle with a soft glow ring (-webkit-slider-thumb and ::-moz-range-thumb pseudo-elements). This gives a consistent branded appearance in Chrome, Firefox, and Safari with no JavaScript.
Adapting the calculator to your pricing model
Edit apiRate, the storage rate, and seatRate at the top of the JS to match your actual pricing. Swap apiTiers for any lookup array that matches your usage bands — compute instances, bandwidth tiers, message counts, or request buckets. Add more slider rows by duplicating a .slider-row in HTML and adding a new dimension to calc(). The breakdown updates automatically.
Build with AI
Build, Understand, Optimize, and Extend It With AI
Instead of working through the index math by hand, paste this snippet's HTML, CSS, and JS into an AI coding assistant like Claude and ask it to explain exactly why the storage slider maps its 0-10 range through Math.round(storIdx * (steps.length-1) / 10) instead of just using storIdx as a direct array index the way the API slider does, and what would go wrong if both sliders used the same approach. It's worth an optimization question too — ask whether recalculating and rewriting all six DOM text nodes on every single oninput tick (which can fire dozens of times per drag) is worth debouncing or batching. For extending it, have it add a free-tier allowance that zeroes out cost below a threshold, a fourth pricing dimension like bandwidth following the existing lookup-array pattern, or an annual-vs-monthly toggle that discounts the computed total. Treat the code less like a finished artifact and more like a starting point for a conversation.
Prompt to recreate it
Copy this into your AI assistant of choice to build the effect from scratch, or as a jumping-off point for your own variant:
Build an interactive usage-based pricing calculator in plain HTML, CSS, and vanilla JavaScript with no libraries.

Requirements:
- Three range inputs, one each for API calls per month, storage in GB, and team seats, each paired with a label showing its current formatted value.
- The API calls slider must run from 0 to 10 but map to a non-linear lookup array of real-world usage tiers (e.g. 0, 1000, 5000, 10000, 25000, 50000, 100000, 250000, 500000, 1000000, 5000000) using the slider's integer value as a direct index into that array, not a linear interpolation.
- The storage slider must similarly run from 0 to 10 but map through a separate lookup array of realistic GB tiers using a rounded index calculation of the form round(sliderValue * (array.length - 1) / 10), since the array has fewer entries than the slider has steps.
- The seats slider can be a direct linear range (e.g. 1 to 50) with a flat per-seat rate.
- On every input event on any of the three sliders, recompute and display: each dimension's individual cost, the value label above each slider, and a running total, all read from constants for the per-unit rates so they're trivial to retune.
- Format large call counts with k/M suffixes (e.g. "50k", "1.2M") and format all prices to two decimal places with a dollar sign.
- Style the native range input's track and thumb consistently across WebKit and Firefox using the vendor-specific pseudo-elements, since the default browser appearance is inconsistent.
Want to tighten it up first? Run this prompt through the AI Prompt Studio to score it across 8 quality dimensions, catch anti-patterns, and tune the wording for Claude, ChatGPT, or Gemini before you paste it in.
Source Code
<div class="calc-wrap">
  <div class="calc-card">
    <div class="calc-header">
      <h2>Estimate your cost</h2>
      <p>Drag the sliders to match your expected usage</p>
    </div>

    <div class="sliders">
      <div class="slider-row">
        <div class="slider-meta">
          <span class="slider-name">API calls / month</span>
          <span class="slider-val" id="v-api">50,000</span>
        </div>
        <input type="range" id="s-api" min="0" max="10" value="5" oninput="calc()">
        <div class="tick-row">
          <span>0</span><span>100k</span><span>500k</span><span>1M</span><span>5M</span><span>10M</span>
        </div>
      </div>

      <div class="slider-row">
        <div class="slider-meta">
          <span class="slider-name">Storage (GB)</span>
          <span class="slider-val" id="v-storage">25 GB</span>
        </div>
        <input type="range" id="s-storage" min="0" max="10" value="5" oninput="calc()">
        <div class="tick-row">
          <span>0</span><span>10</span><span>50</span><span>100</span><span>250</span><span>500</span>
        </div>
      </div>

      <div class="slider-row">
        <div class="slider-meta">
          <span class="slider-name">Team seats</span>
          <span class="slider-val" id="v-seats">5 seats</span>
        </div>
        <input type="range" id="s-seats" min="1" max="50" value="5" oninput="calc()">
        <div class="tick-row">
          <span>1</span><span>10</span><span>25</span><span>50</span>
        </div>
      </div>
    </div>

    <div class="breakdown">
      <div class="b-row"><span>API calls</span><span id="c-api">$2.50</span></div>
      <div class="b-row"><span>Storage</span><span id="c-storage">$1.25</span></div>
      <div class="b-row"><span>Team seats</span><span id="c-seats">$25.00</span></div>
      <div class="b-row total"><span>Estimated monthly</span><span id="c-total">$28.75</span></div>
    </div>

    <div class="cta-row">
      <a href="#" class="btn-primary">Get started free</a>
      <p class="cta-note">Includes $10 free credit every month</p>
    </div>
  </div>
</div>
* { box-sizing: border-box; margin: 0; padding: 0; }
body { font-family: system-ui, sans-serif; background: #f1f5f9; min-height: 100vh; display: flex; align-items: center; justify-content: center; padding: 24px; }
.calc-wrap { width: 100%; max-width: 560px; }
.calc-card { background: #fff; border-radius: 24px; padding: 36px; box-shadow: 0 8px 40px rgba(0,0,0,0.08); display: flex; flex-direction: column; gap: 28px; }
.calc-header h2 { font-size: 22px; font-weight: 800; color: #1e293b; }
.calc-header p { font-size: 13px; color: #64748b; margin-top: 4px; }
.sliders { display: flex; flex-direction: column; gap: 20px; }
.slider-row { display: flex; flex-direction: column; gap: 6px; }
.slider-meta { display: flex; justify-content: space-between; align-items: center; }
.slider-name { font-size: 13px; font-weight: 600; color: #374151; }
.slider-val { font-size: 13px; font-weight: 700; color: #6366f1; background: rgba(99,102,241,0.08); padding: 2px 10px; border-radius: 20px; }
input[type=range] { -webkit-appearance: none; width: 100%; height: 4px; border-radius: 4px; background: #e2e8f0; outline: none; cursor: pointer; }
input[type=range]::-webkit-slider-thumb { -webkit-appearance: none; width: 18px; height: 18px; border-radius: 50%; background: #6366f1; cursor: pointer; box-shadow: 0 0 0 3px rgba(99,102,241,0.2); }
input[type=range]::-moz-range-thumb { width: 18px; height: 18px; border-radius: 50%; background: #6366f1; cursor: pointer; border: none; }
.tick-row { display: flex; justify-content: space-between; }
.tick-row span { font-size: 10px; color: #94a3b8; }
.breakdown { display: flex; flex-direction: column; gap: 0; border: 1px solid #e2e8f0; border-radius: 14px; overflow: hidden; }
.b-row { display: flex; justify-content: space-between; padding: 11px 16px; font-size: 13px; color: #475569; border-bottom: 1px solid #f1f5f9; }
.b-row:last-child { border-bottom: none; }
.b-row.total { background: #f8fafc; font-weight: 700; color: #1e293b; font-size: 15px; }
.b-row.total span:last-child { color: #6366f1; font-size: 18px; }
.cta-row { display: flex; flex-direction: column; align-items: center; gap: 8px; }
.btn-primary { display: block; background: #6366f1; color: #fff; font-size: 15px; font-weight: 700; padding: 13px 36px; border-radius: 12px; text-decoration: none; text-align: center; width: 100%; transition: background 0.15s; }
.btn-primary:hover { background: #4f46e5; }
.cta-note { font-size: 12px; color: #94a3b8; }// API: tiered per 1000 calls
const apiTiers = [0,1000,5000,10000,25000,50000,100000,250000,500000,1000000,5000000];
const apiRate = 0.05; // per 1000
// Storage: linear per GB
const storageTicks = [0,1,2,5,10,25,50,100,250,500];
// Seats: flat per seat
const seatRate = 5; // per seat/mo
function fmt(n) {
return n >= 1000000 ? (n/1000000).toFixed(1)+'M' : n >= 1000 ? (n/1000)+'k' : n+'';
}
function fmtGB(i) {
const steps = [0,1,2,5,10,25,50,100,250,500];
const v = steps[Math.round(i * (steps.length-1) / 10)];
return v === 0 ? '0 GB' : v + ' GB';
}
function fmtPrice(n) { return '$' + n.toFixed(2); }
function calc() {
const apiIdx = +document.getElementById('s-api').value;
const storIdx = +document.getElementById('s-storage').value;
const seats = +document.getElementById('s-seats').value;
const apiCalls = apiTiers[apiIdx];
const storageGB = storageTicks[Math.round(storIdx * (storageTicks.length-1) / 10)];
const apiCost = (apiCalls / 1000) * apiRate;
const storageCost = storageGB * 0.05;
const seatCost = seats * seatRate;
const total = apiCost + storageCost + seatCost;
document.getElementById('v-api').textContent = fmt(apiCalls);
document.getElementById('v-storage').textContent = fmtGB(storIdx);
document.getElementById('v-seats').textContent = seats + ' seat' + (seats > 1 ? 's' : '');
document.getElementById('c-api').textContent = fmtPrice(apiCost);
document.getElementById('c-storage').textContent = fmtPrice(storageCost);
document.getElementById('c-seats').textContent = fmtPrice(seatCost);
document.getElementById('c-total').textContent = fmtPrice(total);
}
calc();Step by step
How to Use
- 1Drag the slidersMove any slider left or right to see the value chip update above the slider and the cost breakdown update below. All three dimensions update independently.
- 2Update pricing ratesIn the JS panel, change apiRate (cost per 1000 API calls), the inline storage rate (0.05 per GB), and seatRate (cost per seat per month) to match your actual pricing.
- 3Update the lookup arraysEdit the apiTiers and storageTicks arrays to match your real usage tiers. Each array index corresponds to one slider step — add or remove values to change the scale.
- 4Add a new pricing dimensionDuplicate a .slider-row in HTML, add a tick-row below it, add a cost variable in calc(), add a new .b-row line in the breakdown, and define the rate as a constant at the top of the JS.
- 5Update the CTA button linkReplace href="#" on .btn-primary with your signup or checkout URL. You can also pass the calculated total as a query parameter to pre-fill a checkout form.
- 6Export in your formatClick "HTML" for a standalone file, "JSX" for a React component using useState and useMemo, or "Tailwind" for a React + Tailwind CSS version.
Real-world uses
Common Use Cases
Got questions?
Frequently Asked Questions
apiTiers and storageTicks are lookup arrays. The slider range is always 0–10, which maps directly to array indices. For storage, Math.round(storIdx * (storageTicks.length - 1) / 10) converts the 0–10 value to an array index. This means each drag step moves to the next tier — 0, 1, 2, 5, 10, 25, 50, 100, 250, or 500 GB — rather than incrementing by a fixed linear amount.
In HTML, duplicate a .slider-row block and give the slider a new id (e.g. s-bandwidth). Add a .b-row for bandwidth to the breakdown section. In JS, define a bandwidthTicks lookup array and bandwidthRate constant. In calc(), read the slider value, look up the bandwidth amount, compute the cost, and update the display elements. The layout stretches automatically to fit the new row.
Click "JSX" to download. In React, create useState hooks for each slider value (apiIdx, storIdx, seats). Wrap the calc logic in a useMemo that depends on all three values and returns an object with apiCost, storageCost, seatCost, and total. Replace oninput with onChange. The lookup arrays and rate constants stay the same.
In calc(), change the API cost line to: const billableCalls = Math.max(0, apiCalls - FREE_API_TIER); const apiCost = (billableCalls / 1000) * apiRate; where FREE_API_TIER is a constant like 10000. The displayed cost shows $0.00 until the user drags past the free tier, then rises from there.