You Might Also Like
Learn Coding Visually
Learn to code with interactive, live-preview playgrounds — HTML, CSS, JavaScript, React & more.
 HTML Playground42 lessons · Click-based · Live preview
 CSS PlaygroundLearn CSS with a live editor
 JavaScript Playground60 lessons · DOM · Async · Canvas
 React PlaygroundLearn React with a live code editor
 GSAP PlaygroundLearn GSAP animation interactively
 SVG Playground44 lessons · shapes · paths · animation
 SCSS Playground45 lessons · Sass modules · tokens
 Tailwind PlaygroundLearn Tailwind CSS with a live editor
 Bootstrap 5 Playground50 lessons · live preview
Step Line Chart — HTML CSS JS Stepped Line (No Lib)
Step Line Chart · Charts · Plain HTML, CSS & JS · Live preview
What's included
Features
About this UI Snippet
Step Line Chart — Staircase Lines for Values That Hold Then Jump
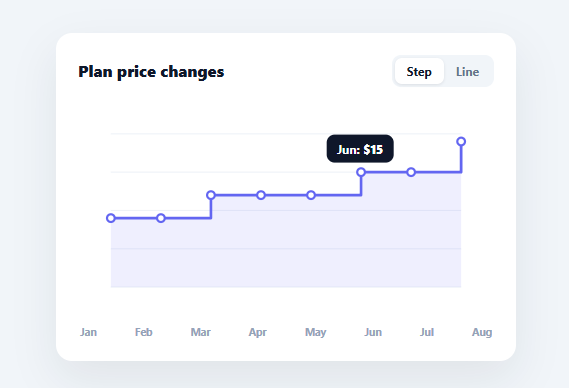
A step line chart draws horizontal-then-vertical "staircase" segments instead of diagonal lines, which is the *correct* way to show values that stay constant until they suddenly change — a price that holds for months then jumps, an inventory level, a feature flag, a thermostat setpoint. A normal line chart would imply a gradual slope between readings that never actually happened. This snippet builds a step line chart in plain HTML, CSS, SVG, and vanilla JavaScript, with a toggle between step and straight-line modes, a filled area, and tooltips — no charting library.
Why steps, not slopes
The semantic point is everything here. If your $9 plan became $12 in March, the price didn't gradually rise through $10 and $11 — it was $9, then instantly $12. A diagonal line lies about the in-between values; a step truthfully shows the value held flat and then jumped. Step charts are the right choice for any quantity that changes discretely and holds between changes, and getting this distinction right is the reason to reach for one.
Building the staircase path
buildPath constructs the SVG path differently per mode. In line mode it simply draws L segments point-to-point. In step mode (after) it draws, for each point, a horizontal segment at the *previous* value's height across to the new x, then a vertical segment up or down to the new value — producing the staircase where each value holds until the next reading, then steps. This "step-after" variant changes the value at each data point; the same idea inverted gives "step-before." It's a few lines of path-building that completely change the chart's meaning.
A toggle to compare
A segmented control flips between Step and Line so you can see the same data both ways — useful for understanding when a step chart is the honest representation. Both modes share the same scaling, dots, and filled area, so only the connecting path changes.
Area fill and point markers
The path is closed down to the baseline and filled with a translucent band, the standard way to add an area under a line in SVG (it makes magnitude easier to read). White-filled dots mark each data point and carry the label and value for tooltips, shown at the cursor via getBoundingClientRect.
Data-driven and drop-in
The chart renders from a LABELS array and a DATA array, with the y-scale rounded to a clean step above the maximum. Swap in your own discretely-changing series — prices, tiers, counts, states — and it draws the staircase. It's a clear reference for building stepped SVG paths and for when step interpolation is the truthful choice over a smooth line.
Build with AI
Build, Understand, Optimize, and Extend It With AI
It's worth having an AI coding assistant like Claude walk you through why buildPath() draws an extra horizontal segment at the previous point's height before the vertical jump in "after" mode, and how that single conditional block is the entire difference between a step chart and a line chart. Ask it to look at optimization angles too — whether rebuilding the whole SVG with innerHTML on every mode toggle is the right call, or whether patching just the path's d attribute would be cheaper for a chart that updates often. For extending the snippet, ask for a "step-before" variant, multiple overlaid series for comparison, or a draggable point that lets a viewer edit a value and watch the staircase redraw live. Treat the code less like a finished artifact and more like a starting point for a conversation.
Prompt to recreate it
Copy this into your AI assistant of choice to build the effect from scratch, or as a jumping-off point for your own variant:
Build a step (staircase) line chart in plain HTML, CSS, and SVG built with vanilla JavaScript — no charting library.

Requirements:
- Render into an inline SVG with a fixed viewBox, generating the chart by creating SVG elements (or building a path string) from a LABELS array and a parallel DATA array of numeric values.
- Implement a path-building function that supports two interpolation modes: "line" draws a straight segment directly between consecutive points, and "after" (step) draws a horizontal segment at the previous point's y-value across to the new x-position, then a vertical segment up or down to the new value — producing a staircase where each value holds flat until the next reading, then jumps.
- Add a segmented toggle control that switches between the two modes and re-renders the same data through the shared path-building function, so users can visually compare a truthful step interpolation against a line that would imply gradual change.
- Close the path down to a baseline and render it as a separately filled, translucent area shape behind the stroked line, using the same point coordinates as the line/step path.
- Compute the y-axis scale by rounding the maximum data value up to a clean interval, and draw evenly spaced horizontal gridlines from that scale.
- Add small circular markers at each data point that store their label and value as data attributes, and show a tooltip near the cursor on hover using the pointer's position relative to the chart container.
Want to tighten it up first? Run this prompt through the AI Prompt Studio to score it across 8 quality dimensions, catch anti-patterns, and tune the wording for Claude, ChatGPT, or Gemini before you paste it in.
Step by step
How to Use
- 1Paste HTML, CSS, and JSA step line chart renders showing a plan price holding then jumping over eight months.
- 2Toggle Step / LineSwitch modes to compare the staircase against a straight-line interpolation of the same data.
- 3Hover a pointSee each point's label and value in a tooltip.
- 4Swap in your dataReplace LABELS and DATA with your own discretely-changing series.
- 5Choose the right modeUse step mode for values that hold then jump; line mode for continuously-changing data.
- 6Wire to an APIFetch your series, assign to DATA, and call render().
Real-world uses
Common Use Cases
Got questions?
Frequently Asked Questions
Use a step chart whenever the value changes discretely and holds constant between changes — prices, inventory, rates, settings, tiers. A straight line between two readings implies the value moved gradually through the in-between numbers, which is false for such data. The staircase truthfully shows the value held flat, then jumped at the moment it actually changed.
For each point after the first, the path draws a horizontal segment at the previous value's height across to the new x-position, then a vertical segment to the new value — so the line holds flat then jumps. This is the "step-after" variant (value changes at each data point). Line mode instead draws a direct L segment between points. Only the path construction differs; scaling and markers are shared.
Step-after (used here) holds the previous value until it reaches the next data point, then steps to the new value — the change happens at the point. Step-before steps to the new value first, then holds it across to the point — the change happens before the point. Which is correct depends on your data's semantics; you can swap the order of the horizontal/vertical segments in buildPath to switch.
The same path used for the line is extended down to the baseline at the last x, across to the first x at the baseline, and closed (Z), forming a filled shape under the line. It's painted with a translucent fill behind the stroked line. Closing a line path to the baseline is the standard SVG technique for an area chart, and it works identically for stepped or straight paths.
In React, hold the data and mode in useState and render the path/dots from the computed values (or run render() in a useEffect with a ref); in Vue, use a computed path string with refs; in Angular, a getter with ViewChild. The buildPath() step logic and scaling are framework-agnostic — only the mode state and rendering move into the framework.