You Might Also Like
Learn Coding Visually
Learn to code with interactive, live-preview playgrounds — HTML, CSS, JavaScript, React & more.
 HTML Playground42 lessons · Click-based · Live preview
 CSS PlaygroundLearn CSS with a live editor
 JavaScript Playground60 lessons · DOM · Async · Canvas
 React PlaygroundLearn React with a live code editor
 GSAP PlaygroundLearn GSAP animation interactively
 SVG Playground44 lessons · shapes · paths · animation
 SCSS Playground45 lessons · Sass modules · tokens
 Tailwind PlaygroundLearn Tailwind CSS with a live editor
 Bootstrap 5 Playground50 lessons · live preview
Sankey Diagram — HTML CSS JS Flow Diagram (No Lib)
Sankey Diagram · Charts · Plain HTML, CSS & JS · Live preview
What's included
Features
About this UI Snippet
Sankey Diagram — Proportional Bezier Flow Ribbons Between Node Columns
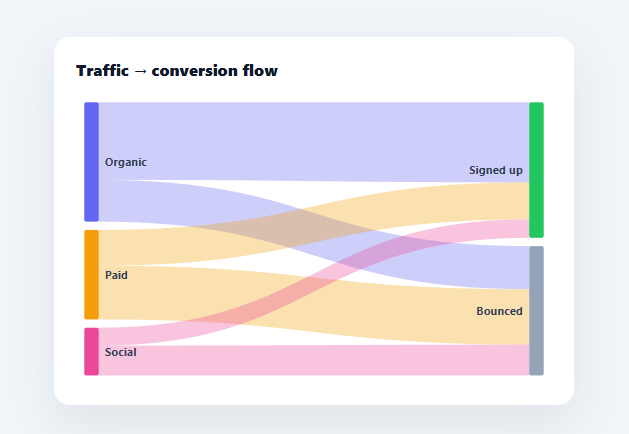
A Sankey diagram visualises *flow* — how a quantity splits and moves from one set of categories to another, with ribbon widths proportional to the amount flowing. It's the chart for "where does the traffic go?", "how does the budget split?", or "how does energy move through the system?". This snippet builds a two-column Sankey in plain HTML, CSS, SVG, and vanilla JavaScript, with value-sized nodes, proportional bezier ribbons, and hover tooltips — no charting library.
Nodes sized by throughput
Each node's height encodes how much flows through it. The snippet sums every link touching a node to get its total, then within each column scales the nodes so they stack to fill the available height (minus gaps). So a source that sends more, or a target that receives more, is taller — the node heights themselves carry information before you even look at the ribbons.
Ribbons that conserve flow
The heart of a Sankey is that ribbon thickness is proportional to value, and the widths *add up*: the ribbons leaving a node exactly fill its right edge, and those entering a node exactly fill its left edge. The snippet achieves this with stacking cursors — each node tracks how far down its edge has been used, so successive ribbons stack without overlap or gap. This flow-conservation is what makes a Sankey readable: you can see that "Paid" sends most of its volume to "Bounced," because that ribbon is visibly thicker.
Smooth bezier connectors
Each ribbon is a filled SVG path with two cubic bezier curves — top and bottom edges that ease from the source's right edge to the target's left edge using a midpoint control, then close into a band. The S-curve is the signature Sankey look and keeps crossing ribbons legible. Ribbons are tinted by their source node and semi-transparent so overlaps read clearly and a hovered ribbon brightens.
Nodes and labels on top
After the ribbons, the node rectangles and their labels are drawn on top, with labels placed outside each column (left of the right column, right of the left column) so they never sit over the flows. Hovering any ribbon shows its source → target and value at the cursor via getBoundingClientRect.
Data-driven and drop-in
The diagram is defined by a NODES map (each with a column and colour) and a LINKS list of { from, to, value }. Swap in your own flows — channels to outcomes, sources to categories, budget to departments — and it sizes the nodes and ribbons automatically. It's a compact, dependency-free reference for the flow-conservation layout and bezier-ribbon drawing that define Sankey diagrams.
Build with AI
Build, Understand, Optimize, and Extend It With AI
You do not have to trace the stacking-cursor logic by hand. Paste this snippet's HTML, CSS, and JS into an AI coding assistant like Claude and ask it to explain exactly how the bottom and inTop cursors stored per node prevent successive ribbons from overlapping or leaving gaps along a node's edge, and why each ribbon path is built from two mirrored cubic bezier curves rather than straight diagonal lines. The same assistant can help you optimize it — ask whether recalculating every node's total by filtering the entire LINKS array once per node (an O(nodes times links) pass) would become a bottleneck with a much larger dataset, and how you would precompute those totals in a single pass instead. It's also useful for extending the diagram: ask it to generalize the fixed two-column layout to support three or more sequential stages, add click-to-filter so clicking a node highlights only its connected ribbons, or animate the ribbons growing in on load instead of appearing instantly. Treat the code less like a finished artifact and more like a starting point for a conversation.
Prompt to recreate it
Copy this into your AI assistant of choice to build the effect from scratch, or as a jumping-off point for your own variant:
Build a two-column Sankey flow diagram in plain HTML, CSS, and JavaScript using inline SVG created with createElementNS — no charting library, no canvas.

Requirements:
- Take a nodes object where each node has a column index (0 for the source side, 1 for the target side) and a color, plus a links array of objects each with a from node id, a to node id, and a numeric value.
- For every node, compute its total throughput by summing the value of every link that touches it (whether as a source or a target), then within each column scale the nodes proportionally so their heights (plus fixed gaps between them) exactly fill the available vertical space.
- Draw each link as a single filled, closed SVG path built from two cubic bezier curves: one curve tracing the top edge from the source node's right edge to the target node's left edge using a horizontal midpoint as the control point, and a mirrored curve tracing the bottom edge back, so the ribbon reads as a smooth S-curve rather than a straight diagonal band.
- Give every node a running "stacking cursor" that tracks how much of its edge has already been consumed by previously drawn ribbons, so that multiple ribbons leaving or entering the same node stack flush against each other with no visual overlap and no gap, and the ribbon thicknesses sum to exactly the node's full height.
- Color each ribbon using its source node's color at a low fill opacity so overlapping ribbons remain visually distinguishable, and increase that opacity on hover.
- Draw the node rectangles and their text labels after all the ribbons (so they render on top), positioning each label outside its column (to the right of left-column nodes, to the left of right-column nodes) so labels never sit on top of a flowing ribbon, and implement a mousemove-driven tooltip that reports the hovered ribbon's source name, target name, and exact numeric value.
Want to tighten it up first? Run this prompt through the AI Prompt Studio to score it across 8 quality dimensions, catch anti-patterns, and tune the wording for Claude, ChatGPT, or Gemini before you paste it in.
Step by step
How to Use
- 1Paste HTML, CSS, and JSA Sankey diagram renders showing traffic sources flowing into signed-up vs. bounced.
- 2Read the ribbonsThicker ribbons mean more flow; node heights show total throughput.
- 3Hover a ribbonSee its source → target and exact value in a tooltip.
- 4Swap in your dataEdit the NODES map (column + colour) and the LINKS list ({ from, to, value }).
- 5Model your flowUse it for channels→outcomes, budget→departments, or any source→target volumes.
- 6Wire to an APIMap your flow data into NODES/LINKS and call render().
Real-world uses
Common Use Cases
Got questions?
Frequently Asked Questions
It shows flow — how a quantity moves and splits from one set of categories to another, with ribbon widths proportional to the amount. Where a bar or pie shows magnitudes or shares at one stage, a Sankey shows the relationships between two (or more) stages: which source feeds which target, and how much. It answers "where does it go?" rather than "how big is it?".
Each ribbon's thickness at a node is value/nodeTotal × nodeHeight. Each node keeps a stacking cursor tracking how much of its edge has been used; successive ribbons start where the previous one ended, so they pack the node's edge exactly with no overlap or gap. This flow-conservation — outgoing ribbons fill the right edge, incoming fill the left — is what makes the diagram readable.
Each ribbon is a closed SVG path made of two cubic bezier curves: the top edge eases from the source's right edge to the target's left edge using a horizontal midpoint as the control point, then a line down the target edge, then the bottom edge curves back, then close. The mirrored beziers create the smooth S-shaped band that's the signature Sankey look and keeps crossing flows legible.
This snippet implements the common two-column (source → target) case, which covers most flow questions. Extending to multiple columns means assigning each node a column index, laying out columns left to right, and drawing links between adjacent (or any) columns with the same stacking-cursor and bezier logic. The ribbon-drawing and flow-conservation code generalises; the layout just gains more columns.
In React, hold NODES/LINKS in state or constants, compute the layout in useMemo, and render rects/paths from .map() (or run render() in a useEffect with a ref); in Vue, use a computed layout with v-for; in Angular, a getter with *ngFor. The node-sizing, stacking, and bezier math are framework-agnostic — only the rendering and tooltip state move into the framework.