You Might Also Like
Learn Coding Visually
Learn to code with interactive, live-preview playgrounds — HTML, CSS, JavaScript, React & more.
 HTML Playground42 lessons · Click-based · Live preview
 CSS PlaygroundLearn CSS with a live editor
 JavaScript Playground60 lessons · DOM · Async · Canvas
 React PlaygroundLearn React with a live code editor
 GSAP PlaygroundLearn GSAP animation interactively
 SVG Playground44 lessons · shapes · paths · animation
 SCSS Playground45 lessons · Sass modules · tokens
 Tailwind PlaygroundLearn Tailwind CSS with a live editor
 Bootstrap 5 Playground50 lessons · live preview
Habit Tracker Grid — Free GitHub-Style Contribution Grid Snippet
Habit Tracker Grid · Dashboards · Plain HTML, CSS & JS · Live preview
What's included
Features
About this UI Snippet
Habit Tracker Grid — Click-to-Cycle Cells With a Real Computed Streak
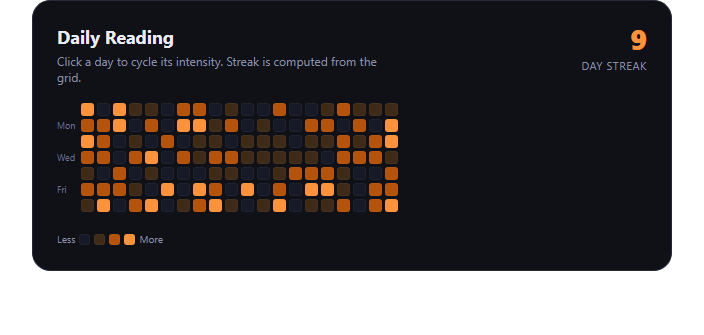
The habit tracker grid is the GitHub-contributions-style calendar that's become the default way to visualize a daily habit: one cell per day, weeks running left to right, intensity shown by color. This snippet builds the interactive version — clickable cells that cycle through four levels, plus a streak counter genuinely computed by scanning the grid data rather than hardcoded.
Four-level cells, click to cycle
Each cell holds an integer 0–3 (none, light, medium, full). Clicking a cell calls cycleCell(idx), which advances that day's value with modulo arithmetic ((grid[idx] + 1) % 4) and updates both its CSS class and its data — so the grid's visual state and its underlying array are always the same source of truth, never out of sync.
A real streak calculation, not a hardcoded number
The headline feature is computeStreak(data): it walks backward from the most recent day (the last element in the flat grid array) and counts consecutive days where the level is greater than zero, stopping at the first day with level 0. This runs fresh every time a cell is clicked via updateStreak() — there's no cached or manually-set streak number anywhere in the code. Toggle today's cell to 0 and watch the streak collapse to 0 immediately; toggle it back and the streak recalculates from the actual data.
Seeded but organic-looking data
The initial 20-week grid is generated with a small seeded pseudo-random function so it reproduces the same layout on every load while still looking like real, varied habit data. The most recent 9 days are deliberately forced to intensity 1+ so there's always a genuine trailing streak to demonstrate the counter working on load, not just after interaction.
Legend and day labels
A four-swatch "Less → More" legend mirrors the same four CSS classes used in the grid, and Mon/Wed/Fri row labels orient the grid the way GitHub's contribution graph does, without cluttering every row.
Customizing it
Swap the seeded generator for real per-day habit data from your backend, change the week count, add a month-label row along the top, or persist clicks to localStorage or an API. Pair it with activity heatmap, streak tracker, or activity rings for a fuller habit-dashboard.
Build with AI
Build, Understand, Optimize, and Extend It With AI
The interesting part of a habit tracker isn't the grid — it's making sure the streak number is trustworthy, so it's worth pasting this snippet's HTML, CSS, and JS into an AI coding assistant like Claude and asking it to trace through computeStreak() to confirm it genuinely recalculates from the grid array on every change rather than incrementing/decrementing a separate counter that could drift out of sync with the actual cell data. It's also worth asking about edge cases: what happens at grid boundaries, whether the streak logic should account for a "grace day" some habit apps allow, or how to extend computeStreak() into a companion function that also finds the longest historical streak (not just the current trailing one) by scanning for the longest run of consecutive non-zero values anywhere in the array. From there, have it help wire the grid to localStorage or a backend so clicks persist across sessions.
Prompt to recreate it
Copy this into your AI assistant of choice to build the effect from scratch, or as a jumping-off point for your own variant:
Build a "habit tracker grid" (GitHub-contributions-style) in plain HTML, CSS, and JavaScript — no dependencies, no CDN.

Requirements:
- Render a grid of cells representing roughly 20 weeks x 7 days (weeks as columns, days as rows), where each cell holds an integer intensity level from 0 (none) to 3 (full), styled with 4 distinct background colors.
- Clicking a cell cycles its level forward (0 -> 1 -> 2 -> 3 -> 0) using modulo arithmetic, updating both the cell's visual class and the underlying data value together.
- Implement a REAL streak-calculation function that takes the grid's flat data array and scans backward from the most recent day, counting consecutive days with intensity > 0, stopping at the first day with intensity 0. Do NOT hardcode the streak number — it must be recalculated by this function every time a cell's value changes, and must correctly drop to 0 if the most recent day is set to "none."
- Show the computed streak number prominently at the top of the card, updating live after every click.
- Include a small 4-swatch legend ("Less" to "More") using the same CSS classes as the grid cells, and light day-of-week labels (e.g. Mon/Wed/Fri) along the left edge.
- Seed the initial data with a reproducible pseudo-random generator so the grid looks organic on load, dark-theme friendly.
Want to tighten it up first? Run this prompt through the AI Prompt Studio to score it across 8 quality dimensions, catch anti-patterns, and tune the wording for Claude, ChatGPT, or Gemini before you paste it in.
Step by step
How to Use
- 1Paste HTML, CSS, and JSA 20-week grid renders with a live streak counter.
- 2Click any cellIt cycles none \u2192 light \u2192 medium \u2192 full \u2192 none.
- 3Watch the streak updatecomputeStreak() rescans the grid after every click.
- 4Zero out the most recent dayThe streak counter drops to 0 immediately.
- 5Wire up persistenceSave the grid array to localStorage or your backend.
Real-world uses
Common Use Cases
Got questions?
Frequently Asked Questions
It's genuinely computed. computeStreak(data) scans the grid array backward from the most recent day, counting consecutive entries greater than 0 until it hits a 0 (or the start of the array). It runs on load and again after every single cell click via updateStreak() — there is no hardcoded or cached streak value anywhere.
The streak immediately drops to 0, because computeStreak() starts scanning from the last element of the array and stops at the first zero it finds — if the most recent day is 0, the streak is 0 regardless of how many active days came before it, exactly like a real habit-tracking streak.
Each cell holds an integer 0-3. Clicking calls cycleCell(idx), which does (grid[idx] + 1) % 4 to advance it, wrapping back to 0 after 3. The cell's CSS class and its underlying array value are updated together in the same function, so they never drift out of sync.
So the demo has a real, non-zero streak visible on first load — otherwise a purely random grid might happen to end on a 0 day and the streak counter would show 0 with nothing to demonstrate. In your real implementation, this would simply be actual user data.
Save the grid array to localStorage (or your backend) inside cycleCell() after updating it, and load it back in place of the seeded generator on page load. The rendering and streak logic work unchanged against any grid array shaped as a flat list of 0-3 values.