You Might Also Like
Learn Coding Visually
Learn to code with interactive, live-preview playgrounds — HTML, CSS, JavaScript, React & more.
 HTML Playground42 lessons · Click-based · Live preview
 CSS PlaygroundLearn CSS with a live editor
 JavaScript Playground60 lessons · DOM · Async · Canvas
 React PlaygroundLearn React with a live code editor
 GSAP PlaygroundLearn GSAP animation interactively
 SVG Playground44 lessons · shapes · paths · animation
 SCSS Playground45 lessons · Sass modules · tokens
 Tailwind PlaygroundLearn Tailwind CSS with a live editor
 Bootstrap 5 Playground50 lessons · live preview
Grouped Bar Chart — Clustered Multi-Series Bars
Grouped Bar Chart · Charts · Plain HTML, CSS & JS · Live preview
What's included
Features
About this UI Snippet
Grouped Bar Chart — Clustered Multi-Series Bars with Tooltips
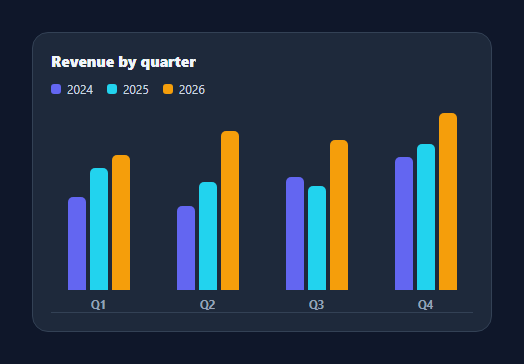
A grouped bar chart (also called a clustered bar chart) places several series side by side within each category, so you can compare both across categories and between series at a glance — sales across years per quarter, scores per metric, and the like. This snippet builds one with pure HTML and CSS bars, animated growth, a legend, and tooltips, in plain HTML, CSS, and vanilla JavaScript — no SVG, no chart library.
Flexbox layout, no coordinate math
Each category is a flex column; inside it the series bars sit in a row, bottom-aligned. Bar heights are simple percentages of the chart height (value / max), so there's no axis or pixel math — the browser's layout engine does the work, and the chart is naturally responsive. The y-scale rounds the maximum up to a clean number so the tallest bar doesn't touch the top.
Consistent color encoding
Each series gets one colour used for its bar in every group, and the legend ties colours to series names. This is the whole point of a grouped chart: the eye follows a colour across categories to read a trend ("the amber series climbs every quarter") while still comparing the cluster within each category.
Animated growth
Bars start at zero height and animate up to their value on load via a CSS transition triggered on the next frame — a small touch that draws attention to the data and reads as "this just rendered." A subtle brightness lift on hover gives per-bar feedback.
Cursor-following tooltips
Hovering any bar shows a tooltip with the category, series, and value, positioned relative to the card and following the pointer. Because tooltips are driven by simple mouse coordinates rather than chart geometry, they're robust at any size and easy to extend with more detail.
Data-driven and portable
Series are defined once (name, color) and groups are { label, values }, so adding a series or a category is a data edit — the bars, legend, scale, and tooltips all derive from it. With no SVG or dependency, it's a clean, lightweight reference for the clustered-bar pattern that's easy to drop into any dashboard.
Build with AI
Build, Understand, Optimize, and Extend It With AI
You don't need to trace the layout math by hand to understand this chart. Paste the HTML, CSS, and JS into an AI coding assistant like Claude and ask it to explain exactly how the max value gets rounded up to set the y-scale, and why bar heights are expressed as percentages instead of pixel values computed in JavaScript. The same assistant is useful for optimizing it — ask whether recomputing every bar's height on window resize would be cheaper than the current fixed-at-render approach, or whether the tooltip's mousemove listener needs throttling for a chart with many more bars. It is just as handy for extending the effect: ask it to add a stacked-total mode alongside the grouped view, animate the legend to fade groups in and out on click, or drive the SERIES and GROUPS arrays from a live fetch call. Treat the code less like a finished artifact and more like a starting point for a conversation.
Prompt to recreate it
Copy this into your AI assistant of choice to build the effect from scratch, or as a jumping-off point for your own variant:
Build a grouped (clustered) bar chart in plain HTML, CSS, and JavaScript using only flexbox for layout — no SVG, no canvas, no charting library.

Requirements:
- Two data structures: an array of series objects (name, color) and an array of group objects (label, values array, one value per series, in series order).
- Compute the maximum value across every group's values array, then round it up to the next multiple of ten to use as the chart's scale ceiling.
- Render one flex column per group, each containing a row of bars (one per series, bottom-aligned, using flexbox rather than absolute positioning), with every bar's height set as a CSS percentage of the container (value divided by the rounded max), not a pixel value computed from container measurements.
- Each bar must animate its height from 0% up to its target percentage after insertion, triggered via a double requestAnimationFrame so the browser commits the zero-height state before the transition starts.
- Generate a legend above the chart from the series array, pairing each series' name with a small colored swatch in that series' color.
- On mouseenter and mousemove over any bar, show a tooltip positioned relative to the chart card's bounding rect (not the viewport) that follows the cursor and displays the group label, series name, and value; hide it on mouseleave.
- Everything must be data-driven: adding a series (with a new color) or a group (with a matching-length values array) should require no changes outside the two data arrays.
Want to tighten it up first? Run this prompt through the AI Prompt Studio to score it across 8 quality dimensions, catch anti-patterns, and tune the wording for Claude, ChatGPT, or Gemini before you paste it in.
Step by step
How to Use
- 1Paste HTML, CSS, and JSA grouped bar chart renders with three series across four quarters.
- 2Use your dataEdit SERIES (name + color) and GROUPS ({ label, values }).
- 3Watch it animateBars grow from zero to their value on load.
- 4Hover a barA tooltip shows the category, series, and value.
- 5Read by colorFollow a series color across groups to spot trends.
- 6RestyleChange colors, bar width, gap, or chart height.
Real-world uses
Common Use Cases
Got questions?
Frequently Asked Questions
For a grouped bar chart, CSS flexbox is simpler and naturally responsive: each bar is a div whose height is a percentage of the container, so there is no viewBox, no coordinate mapping, and no manual resize handling. SVG shines for curves, arcs, and precise axes; for rectangular bars, letting the layout engine size them keeps the code short and fluid.
The script finds the maximum value across all series and rounds it up to the next ten, then every bar's height is value divided by that maximum, as a percentage. Rounding up gives headroom so the tallest bar does not touch the top edge and the proportions stay readable. You can change the rounding granularity to suit your data range.
Grouping places each series next to the others within a category, so you compare series within a group directly, while consistent per-series colors let you track one series across categories to see its trend. It answers two questions at once — "which is biggest here?" and "how does this series change over time?" — which a single-series or stacked chart cannot.
Add an entry to SERIES (a name and color) and a matching value to each group's values array; or add a group with its own label and values. The legend, scale, bars, and tooltips all derive from these arrays, so no other code changes. Keep each group's values array the same length as SERIES.
Map your series and groups to elements in JSX/templates, setting each bar's height from value/max as an inline style. Trigger the grow animation with a mounted effect or a CSS class toggled after render. Track hover state for the tooltip. Recharts or Chart.js can replace the rendering, but the data shape stays the same. Tailwind users apply heights and colors with utilities.