You Might Also Like
Learn Coding Visually
Learn to code with interactive, live-preview playgrounds — HTML, CSS, JavaScript, React & more.
 HTML Playground42 lessons · Click-based · Live preview
 CSS PlaygroundLearn CSS with a live editor
 JavaScript Playground60 lessons · DOM · Async · Canvas
 React PlaygroundLearn React with a live code editor
 GSAP PlaygroundLearn GSAP animation interactively
 SVG Playground44 lessons · shapes · paths · animation
 SCSS Playground45 lessons · Sass modules · tokens
 Tailwind PlaygroundLearn Tailwind CSS with a live editor
 Bootstrap 5 Playground50 lessons · live preview
Dependency Graph Viewer — Free HTML CSS JS Snippet
Dependency Graph Viewer · Dashboards · Plain HTML, CSS & JS · Live preview
What's included
Features
About this UI Snippet
Dependency Graph Viewer — Hand-Written Force Simulation, Repulsion, Springs & Damping in Vanilla JS
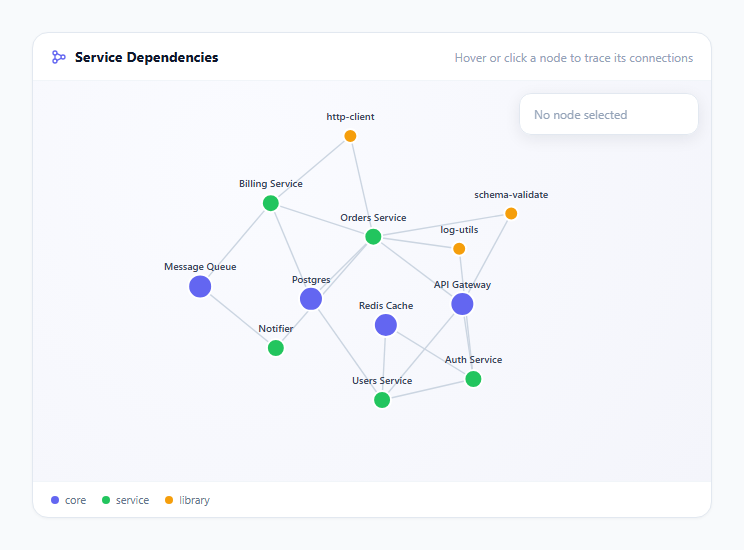
Dependency graphs, service maps, and package trees are usually rendered with heavyweight libraries like D3-force, Cytoscape, or vis-network — multi-hundred-kilobyte dependencies for what is, at its core, two simple physics rules applied every animation frame. This snippet builds a force-directed graph layout from scratch: no physics engine, no charting library, just a requestAnimationFrame loop that nudges node positions based on repulsion and spring forces until the layout settles into something readable. It renders a set of services (API Gateway, Auth, Orders, Billing, a Postgres core, a Redis cache, a couple of shared libraries) as SVG circles connected by lines, and lets you hover or click any node to trace exactly what it depends on and what depends on it.
The two forces: repulsion and springs
Every pair of nodes repels each other, the same way charged particles push apart in a simplified Coulomb's-law model. For each pair, the code computes the distance between them and applies a force proportional to REPULSION / distSq along the line connecting them — closer nodes push apart harder, distant nodes barely notice each other. This is what keeps nodes from all collapsing into a single point. Independently, every *edge* in the dependency list acts like a spring: the code measures the current distance between the two connected nodes, subtracts a REST_LENGTH (90px) to get the stretch amount, and applies a force proportional to that stretch times a spring constant SPRING_K. Stretched-too-far edges pull their nodes together; compressed edges push them apart. Nodes with no edge between them never feel a spring force at all — only the constant repulsion. The interplay of these two forces is the entire layout algorithm: repulsion pushes everything apart, springs pull connected things back together, and the graph naturally organizes into clusters where tightly-connected services sit close and unrelated nodes drift to the edges.
Why damping is non-negotiable
Without friction, a spring-and-repulsion system oscillates forever — every force calculation adds velocity, and with nothing removing energy from the system, nodes would swing past their equilibrium position, get pulled back, overshoot again, and never settle. Real springs lose energy to heat and air resistance; this simulation fakes that by multiplying every node's velocity by a DAMPING constant (0.86) at the end of every frame, after forces are applied but before the position update. Each frame throws away about 14% of the node's speed. Early on, when forces are large and nodes are moving fast, damping barely dents the motion and the layout unfolds quickly. As the layout approaches equilibrium and forces shrink, the same proportional damping increasingly dominates, so velocities decay toward zero and the graph visibly stops jittering rather than vibrating indefinitely. A small constant center-pull force (CENTER_PULL) is also applied toward the canvas midpoint on every node, which keeps loosely-connected corner nodes from drifting off toward infinity since repulsion alone has no bound.
Integration: velocity, then position, every frame
The tick() function runs once per animation frame. It first zeroes nothing — velocities persist between frames — and accumulates every repulsion and spring force into each node's vx/vy. Only after all forces for the frame are summed does it apply damping and then update x/y by adding the (now-damped) velocity. This order matters: computing all forces before touching any position means the physics for this frame is based on a single consistent snapshot of the graph, not a partially-updated one where some pairs used old positions and others used new ones (a subtle bug that produces asymmetric, jittery layouts if forces are applied node-by-node instead of batched).
SVG for rendering, not canvas
Nodes are individual <circle> and <text> SVG elements rather than a single <canvas> bitmap. This trade-off costs a little performance at very large node counts, but it means each node is a real DOM element that can receive its own mouseenter and click listeners directly, and CSS classes like .dim and .edge-active can be toggled with ordinary classList calls and animate via CSS transitions instead of manual redraw logic. For the dozen-to-few-dozen node counts typical of a service map or package tree, this is both simpler to read and cheaper to maintain than a canvas hit-testing layer.
Hover-to-trace highlighting
Selecting a node (via hover, or click to pin) computes its direct deps (outgoing edges) and dependents (incoming edges) by scanning the edge list. Every edge touching the selected node gets an .edge-active class; every other edge gets .edge-dim, which CSS fades to 12% opacity. The same happens for node circles and labels not in the connected set. This is purely a CSS-class-toggle operation layered on top of the physics loop — the simulation keeps running underneath regardless of what is currently highlighted, so hovering never interrupts or resets the layout.
Build with AI
Build, Understand, Optimize, and Extend It With AI
Paste this snippet's JS into an AI assistant like Claude and ask it to walk through exactly why forces are accumulated into vx/vy for every node before any position is updated, rather than updating each node's position as soon as its forces are computed — it's a subtle but important ordering bug to understand before you modify the simulation. It's also worth asking the assistant to explain the physical intuition behind why REPULSION and SPRING_K need to be tuned together, since changing one without the other can either collapse the graph into a tight ball or blow it apart. For extending the snippet, ask for drag-to-reposition support with mouse events pinning a node while dragged, a toggle between this hand-rolled simulation and a canvas-based renderer for larger graphs, or a directional arrowhead on each edge to show dependency direction rather than an undirected line.
Prompt to recreate it
Copy this into your AI assistant of choice to build the effect from scratch, or as a jumping-off point for your own variant:
Build an interactive force-directed dependency graph in plain HTML, CSS, and JavaScript, rendered as SVG — no D3, no physics library, no external dependencies.

Requirements:
- A small dataset of named nodes (with a group/category field) and an edge list of directed id pairs representing dependencies.
- A hand-written force simulation running inside a requestAnimationFrame loop: every node pair repels each other with a force inversely proportional to the square of the distance between them (like Coulomb's law), and every edge acts as a spring pulling its two nodes toward a fixed rest length using Hooke's law (force proportional to how far the current distance is from the rest length).
- Accumulate all forces for a frame into each node's velocity BEFORE updating any node's position, so the physics for that frame is based on one consistent snapshot rather than partially-updated positions.
- Apply a damping multiplier (roughly 0.85-0.9) to every node's velocity each frame, and explain in a comment why the simulation would oscillate forever without it.
- Add a small constant pull-toward-center force so nodes with few or no connections do not drift off the visible canvas.
- Render nodes as SVG circles with text labels and edges as SVG lines, updating their x/y/x1/y1/x2/y2 attributes every frame from the simulation state.
- Hovering a node should highlight it plus its direct dependencies and dependents (full opacity, edges colored) while dimming every unrelated node and edge; clicking a node should pin that highlight until clicked again.
- A small side panel showing the currently selected node's name and a live count of its outgoing and incoming connections.
Want to tighten it up first? Run this prompt through the AI Prompt Studio to score it across 8 quality dimensions, catch anti-patterns, and tune the wording for Claude, ChatGPT, or Gemini before you paste it in.
Step by step
How to Use
- 1Watch the graph settle into a layoutOn load, twelve nodes start in a rough circle and immediately begin repelling each other while their dependency edges pull connected nodes together. Within a second or two the jitter visibly damps out and the layout stabilizes.
- 2Hover any node to trace its connectionsMoving the mouse over a node dims every unrelated node and edge, leaving only the hovered node, its direct dependencies, and its dependents at full opacity — with the active edges turned indigo.
- 3Click a node to pin the highlightClicking locks the highlight so you can move the mouse to the side panel or elsewhere without losing the trace. Click the same node again to unpin and return to the neutral view.
- 4Read the side panel countsThe panel in the top-right shows the selected node's exact name plus a live count of how many services it depends on and how many depend on it, updating instantly on hover or click.
- 5Drag never breaks the simulationBecause the layout is recomputed every frame from live x/y state rather than a one-time calculation, resizing the container or leaving the tab and returning never leaves the graph in a broken or frozen state.
Real-world uses
Common Use Cases
Got questions?
Frequently Asked Questions
Damping (0.86 per frame) reduces velocity multiplicatively, not to exactly zero, so technically the simulation approaches rest asymptotically rather than stopping outright. In practice velocities drop below a visually perceptible threshold within a second or two. If you want it to fully halt and stop consuming CPU, add a check in tick() that sums the total velocity magnitude across all nodes and calls cancelAnimationFrame instead of requesting the next frame once that sum drops below a small threshold like 0.05.
Edit the NODES array (each entry needs an id, label, and group of core/service/lib) and the EDGES array (pairs of ids). The DOM elements, force calculations, and highlight logic all derive from these two arrays automatically — no other code needs to change. New nodes start positioned around a circle and the simulation settles them into place within the first second.
The repulsion step is O(n^2) since every node pairs with every other node each frame, so it stays comfortably smooth up to roughly 100-150 nodes on typical hardware. Past that, either reduce the update frequency (skip every other frame), switch to a spatial partitioning approach like a quadtree (the technique D3-force and Barnes-Hut simulations use), or fall back to a canvas renderer instead of individual SVG DOM elements.
Yes. In React, move the tick() requestAnimationFrame loop into a useEffect with an empty dependency array, store the animation frame id in a ref, and call cancelAnimationFrame(ref.current) in the cleanup function so the loop stops on unmount. In Vue, start the loop in onMounted and cancel it in onUnmounted. In Angular, start it in ngAfterViewInit and cancel it in ngOnDestroy. In every framework, the node/edge DOM elements can stay as directly-manipulated SVG refs rather than being re-rendered through the framework's virtual DOM each frame, since the position updates need to run at 60fps outside the framework's normal render cycle.
Add a fixed: true flag to a node in NODES, then in tick(), skip the velocity/position update block for any node where nodeMap[id].fixed is true (still let it participate in repulsion and spring forces affecting other nodes, just do not move it). This is the same "pinned node" pattern D3-force calls fx/fy.